Key findings
The consecutive declines in Korean equities on 12–13 October 2026 are most plausibly understood as a reassessment of the durability of semiconductor earnings occurring alongside weaker marginal buying capacity, with index concentration and risk constraints amplifying the adjustment. One Samsung Electronics buyback programme has completed its purchases: that is a verifiable change in buyer behaviour. Extending this observation into the claim that “Samsung and SK hynix have both completed their buybacks, leaving the market without buyers” crosses two boundaries, from fact to generalisation and from association to causation. SK hynix was still purchasing shares on 12 October and had submitted a purchase application for 13 October. The purposes of the two programmes also differ; they cannot be treated as the same long-term shareholder-return instrument. [1] [2]
At the 13 October close, the KOSPI and KOSDAQ were approximately 5.46% and 1.43% below their previous closes; Samsung ordinary shares and SK hynix were approximately 7.39% and 10.09% lower. Both indices and Samsung stood above the morning and afternoon observations recorded in this edition, while SK hynix weakened further. Estimated full-day foreign net selling of approximately KRW 4.5 trillion in KOSPI cash equities is a closing-news trading estimate, not settled cross-border capital flow. The divergence into the close requires broader market pressure and security-specific repricing to be examined separately. [32] [33]
Our assessment distinguishes three horizons. In the short term, a reduced buyback buffer, foreign cash-equity selling and changes in order-book absorption may increase the price response to a given information shock. Over the medium term, memory competition, returns on AI infrastructure investment and the persistence of high margins shape the valuation investors assign to the next phase of earnings. Over the long term, product qualification, costs, customer retention and the efficiency of cash reinvestment are more informative about competitive position than a single share-price rebound. Collapsing these horizons into either “the AI bubble has burst” or “this is merely a technical shakeout” discards important information.
The most useful framework at present is a reassessment of fundamental expectations meeting weaker absorption capacity, rather than a search for one cause of the entire decline. The end of a buyback may increase fragility; competitive information may reduce willingness to pay; foreign selling is an observable behaviour through which prices adjust. Leveraged products and risk budgets may further concentrate trading. Estimating how much they amplified today’s move, however, requires contemporaneous assets, subscriptions and redemptions, and hedging records. A historical model cannot supply an event-specific attribution percentage.
Market observations comprise the 12 and 13 October closes and the 13 October intraday snapshots at 11:47 and 13:15 KST. Corporate and industry information reflects material available on 13 October. Intraday observations, closing prices and news-based flow estimates are labelled separately. This study examines public-market mechanisms and is not investment advice, a trade recommendation or a position disclosure. It develops testable explanations, verifies key figures and identifies observations that would change the assessment.
Event chronology and verifiable market observations
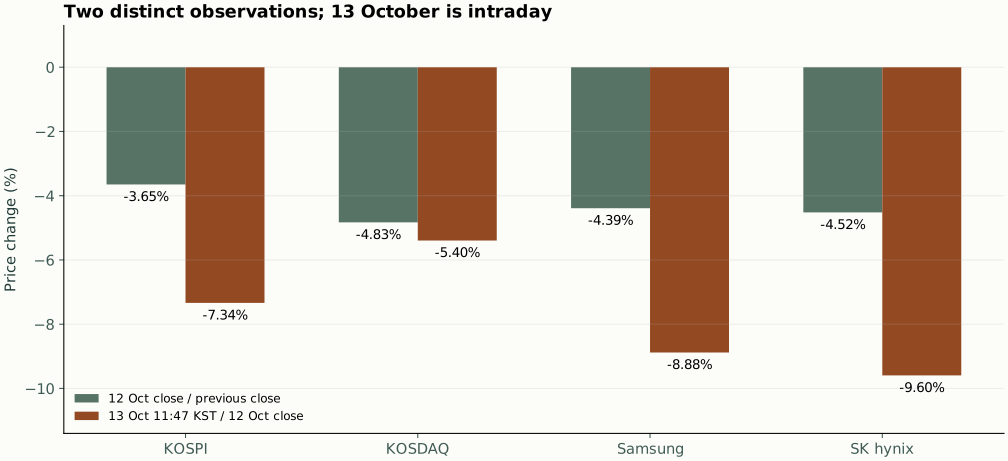
Before asking why the market fell today, the adjacent trading sessions need to be separated. On 12 October the KOSPI closed at 6,384.24, down 3.65% from the preceding session; the KOSDAQ closed at 849.19, down 4.83%. Samsung ordinary shares closed at KRW 250,500 and SK hynix at KRW 1,605,000. Korea’s market holiday on 9 October meant that the 12 October session could incorporate accumulated overseas information. It does not justify combining different US trading sessions into an unverified return. [4]
The 13 October session is a second stage, rather than a repetition of the previous day’s observations. Hankyung reported a KOSPI level of 5,991.94, down 6.14%, and a KOSDAQ level of 811.49, down 4.44%, at 10:27 KST. Newsway recorded a weaker snapshot at 11:47. Together, these observations show selling pressure continuing through the morning rather than a single opening gap. They do not reconstruct the minute-by-minute path, establish the worst execution point or determine whether an afternoon recovery occurred. [5] [3]
Using the preceding close consistently as the denominator, the change from 6,384.24 to 5,915.81 is approximately −7.3373%, consistent with the reported intraday decline of 7.34%. The reference close of 6,625.93 on 8 October is reconstructed from the 12 October close and its 241.69-point decline; the cumulative change from that level to the intraday snapshot is approximately −10.72%. Cumulative returns are calculated from price ratios, not by simply adding daily percentage declines. The distinction matters during a sharp sell-off because the second day’s percentage is applied to an already lower index level. [6] [3]
Similarly, the price change from 7,003.74 on 2 October to 5,915.81 at 11:47 is approximately −15.53%. A reported figure of 18.39% uses the ending rather than starting level as its denominator and is not the conventional return over that interval. The starting observation is not established as the historical high, so the result is not the year’s maximum drawdown either. It is a comparison between two specified observations. Event research should label daily returns, interval changes and drawdowns from a running peak separately. [3]
Intraday flows also require an observation time. Foreign investors’ net cash-equity selling was approximately KRW 1.9823 trillion at 10:27 and KRW 2.7933 trillion at 11:47. Additional net selling of approximately KRW 0.8110 trillion coincided with a further fall in the index. This supports the description of continuing foreign selling during the morning, but does not establish that those additional transactions independently caused the entire subsequent decline. Falling prices can themselves prompt risk-management systems to reduce holdings: causality may run in both directions. [5] [3]
Each snapshot uses its own observation time and the appropriate previous close. The 11:47 market observation and the 12:29 publication time are recorded separately; the 13:15 observation is presented separately. These records allow readers to reproduce the same calculations and prevent later information from being incorporated into an earlier assessment.
On narrow screens, scroll the table horizontally. Keyboard users can focus it and use the arrow keys.
| Series | 12 Oct close | Change | 13 Oct 11:47 KST | Vs 12 Oct close |
|---|---|---|---|---|
| KOSPI | 6,384.24 | -3.65% | 5,915.81 | -7.34% |
| KOSDAQ | 849.19 | -4.83% | 803.37 | -5.40% |
| Samsung ordinary shares / KRW | 250,500 | -4.39% | 228,250 | -8.88% |
| SK hynix / KRW | 1,605,000 | -4.52% | 1,451,000 | -9.60% |
Sources: closing reports and the 11:47 KST observation. The two observations use their respective previous closes. [4] [3]
Afternoon observations and market absorption
At the separate 13:15 KST observation, the KOSPI was 5,982.00, approximately 6.30% below its previous close, and the KOSDAQ was 822.26, down approximately 3.17%. Samsung ordinary shares were KRW 230,750 and SK hynix KRW 1,451,000, approximately 7.88% and 9.60% below their previous closes. Both indices and Samsung were higher than at 11:47; SK hynix had the same price at the two observations. These discrete observations do not reconstruct the full trading path or identify the daily low. [30]
At the same 13:15 observation, foreign investors had net sold approximately KRW 3.4700 trillion in the KOSPI cash market, while individuals and institutions had net bought approximately KRW 1.9036 trillion and KRW 1.1561 trillion. Cumulative foreign net selling was larger than in the morning, yet the index stood above its 11:47 level. Price and one investor category’s cumulative net trading do not have a one-to-one relationship. Additional limit-order demand, the timing of sales, quotes and risk adjustments may change the price effect of comparable trading pressure. These snapshots are not used to estimate each factor’s independent contribution. [30]
Market scope also matters. The report records approximately KRW 0.2091 trillion of foreign net purchases in the KOSDAQ, opposite to the contemporaneous KOSPI direction. One market’s investor-category net trading cannot represent the direction of capital across all Korean equities or be described directly as settled cross-border remittance. The afternoon observation supports continued examination of market absorption but does not establish that risk has subsided. [30]
On narrow screens, scroll the table horizontally. Keyboard users can focus it and use the arrow keys.
| Series | 11:47 KST | 13:15 KST | 13:15 vs previous close |
|---|---|---|---|
| KOSPI | 5,915.81 | 5,982 | -6.30% |
| KOSDAQ | 803.37 | 822.26 | -3.17% |
| Samsung / KRW | 228,250 | 230,750 | -7.88% |
| SK hynix / KRW | 1,451,000 | 1,451,000 | -9.60% |
Source: the Newsworks report published at 13:32 KST, describing the 13:15 observation. [30]
Closing observations: recovery, divergence and flow estimates
The regular session on 13 October ended at 15:30 KST. The KOSPI closed at 6,035.35, approximately 5.46% below its previous close; the KOSDAQ closed at 837.03, down approximately 1.43%. Samsung ordinary shares closed at KRW 232,000, down approximately 7.39%, and SK hynix at KRW 1,443,000, down approximately 10.09%. These closing prices are reported separately from the two earlier intraday observations. All daily returns use the preceding trading day’s close. [32]
Both indices and Samsung ended above their 11:47 and 13:15 observations, while SK hynix ended below both. This divergence is more informative than a blanket claim that Korean equities lacked buyers: absorption can change during a session, and individual securities can respond differently to industry information, valuation and investor risk constraints. It does not identify the daily low or the start of a rebound, nor does recovery into the close establish that medium-term risks have been resolved. [32] [30]
MoneyToday’s closing report estimated approximately KRW 4.5 trillion of foreign net selling in the KOSPI cash market, against approximately KRW 2.24 trillion and KRW 1.69 trillion of net purchases by individuals and institutions. It still reported foreign net purchases in the KOSDAQ, approximately KRW 139.9 billion. The different market directions reinforce the need to preserve classification scope. These are news estimates of full-day trading, not final official investor classifications or settled cross-border flows. [33]
The closing news reports differ slightly on flows: MoneyToday reported KOSPI foreign net selling of KRW 4.5330 trillion, while the updated Seoul Shinmun report gave KRW 4.5157 trillion. The analysis uses approximately KRW 4.5 trillion, preserving the source discrepancy rather than treating the last reported digits as final official statistics. Some individual-stock quotes in the two articles also differ. This section uses YTN’s explicitly identified closing prices, cross-checked against quotation pages marked as that day’s close. [33] [34] [32]
The 15:30 USD/KRW reference price was KRW 1,345.1 per US dollar, KRW 10.0 higher than the preceding day, indicating a weaker won against the dollar. An unhedged dollar investor must account separately for the local-currency equity move and the exchange-rate move; a weaker won further affects dollar-denominated returns. This is a time-specific reference price, not the final rate at the end of extended foreign-exchange trading. [32]
| Series | Close | Vs previous close |
|---|---|---|
| KOSPI | 6,035.35 | -5.46% |
| KOSDAQ | 837.03 | -1.43% |
| Samsung / KRW | 232,000 | -7.39% |
| SK hynix / KRW | 1,443,000 | -10.09% |
Analysing causes without treating correlation as attribution
A market decline may have a trigger, a transmission channel, an amplification mechanism and background conditions at the same time. A trigger is new information that changes investors’ assessments at a particular moment. A transmission channel connects that information to orders, valuations or risk allocation. An amplifier turns a limited shock into a larger price adjustment. Background conditions explain why the market is especially sensitive at this stage. A buyback ending primarily changes absorption conditions; a competitor’s product roadmap informs expected earnings; foreign net selling is both a trading outcome and a transmission behaviour.
A stronger causal explanation should satisfy at least three tests: temporal ordering, a plausible mechanism and relative performance. The information must have been available before the decline; it must plausibly change the relevant securities’ cash flows or buying capacity; and the affected securities or periods should underperform a reasonable comparison group. Finding a plausible story after prices fall does not distinguish an actual trigger from a narrative subsequently attached to the move.
Samsung’s last actual purchase is confirmed as 6 October, followed by several further trading sessions. The 13 October market was therefore not suddenly losing that programme’s buying for the first time. Investors may have priced in its expected completion beforehand, or recognised its importance only when absorption weakened. Distinguishing these mechanisms requires daily execution, trading participation and disclosure-availability times, rather than a line drawn between the completion date and a falling price chart. [1]
Foreign selling does not reveal one common motive. Fundamental active funds, passive funds, arbitrageurs, derivatives hedgers and cross-asset allocators can all enter the foreign-investor category. Some may sell because of competition risk, others to reduce a weight increased by past gains, and others to meet client redemptions. Trading classifications identify which account category was a net seller; they do not disclose every account’s investment thesis.
Counterfactual questions remain useful. Would Korea have fallen if Samsung’s purchases had continued but global memory expectations had deteriorated by the same amount? Would the end of the buyback alone, without negative information, have produced a decline of this scale? How would prices have responded if local long-term investors had absorbed more of the foreign selling? These are not completed statistical estimates, but they clarify whether an explanation covers the observations or only part of a persuasive narrative.
Accordingly, we have greater confidence that the end of a buyback increased short-term fragility than that it was the central cause of the entire decline. We have greater confidence that foreign investors generated identifiable selling pressure than that they were uniformly withdrawing from Korea for one reason. The strength of a judgment should follow its evidence, not its headline. An institutional conclusion can be clear without pretending that every causal contribution has been identified.
Samsung’s completed programme does not describe both companies
Samsung’s plan disclosed on 21 August proposed purchasing approximately 53.2860 million ordinary shares for approximately KRW 15 trillion, over 24 August–21 November. The result disclosed on 12 October records the last actual purchase on 6 October, with 56,856,305 shares acquired for approximately KRW 14.9999999 trillion over 29 trading days. The actual share count exceeded the initial estimate because execution prices and the spending constraint affected the quantity acquired; it did not mean that the authorised amount had increased. [7] [1]
The purpose of this programme is employee equity awards. It differs from a purchase-and-cancellation programme. Both may create cash-market demand when executed, but future delivery of award shares has different long-term supply consequences from cancellation, which reduces issued shares and prevents those particular shares from being delivered again. The shared label “buyback” does not justify assigning identical long-term supply effects or cash-return narratives to the two companies.
Dividing total spending by the 29 actual purchasing days gives Samsung average daily purchases of approximately KRW 0.5172 trillion. This is an execution-period average, not the amount purchased on the final day, 6 October, or a certain quantity of missing demand on each subsequent day. It demonstrates the programme’s substantial trading scale. Measuring its participation rate would additionally require Samsung ordinary shares’ daily traded value over the same period; neither total KOSPI turnover nor the company’s entire market capitalisation is an appropriate substitute denominator.
On 19 August, SK hynix authorised a purchase-and-cancellation programme of approximately KRW 40 trillion, with an indicative quantity of 24,070,000 shares and an execution period of 20 August–19 November. The plan states that the acquired shares will subsequently be cancelled. The indicative quantity and expected three-month window describe the authorisation, not completion as of 13 October. [8] [9]
Public KRX KIND execution records show that SK hynix both planned and acquired 400,000 shares on 12 October. Its next-session application, submitted on 12 October, planned another 400,000 shares for 13 October. A planned purchase is not a confirmed execution, but the actual 12 October purchases already contradict the claim that both programmes had ended. Progress measured against the indicative share quantity is not automatically progress against the spending amount. Execution prices, price constraints and programme adjustments can change the final share count. [2] [10]
A more defensible description is that Samsung’s scheduled demand under this programme has ceased, while SK hynix continues to buy and investors are assessing its execution pace and the potential demand gap after completion. The changes are asynchronous. If SK hynix purchases shares on a day when its price still falls substantially, company demand is insufficient to absorb all selling at the preceding price. This neither means that buyers are absent nor establishes that the buyback has no effect.
“Buyback support” is normally relative. Companies have spending limits, daily plans, execution-price constraints and governance requirements; they do not promise unlimited purchases at any quoted price. Other investors must still assess the use of cash. Buybacks may reduce funds for future investment, increase financing requirements or substitute for other shareholder distributions. The link between repurchases and long-term value depends on the purchase price relative to operating value and on whether the remaining capital supports the next competitive cycle.
This distinction is especially important for Korean memory producers. Industry investment entails upfront spending, construction lead times and technical renewal. Large repurchases and capacity expansion can coexist when cash is abundant, but weaker demand expectations can create trade-offs between plans previously affordable together. The larger the buyback, the more necessary it is to examine operating cash flow, required capital expenditure and future financial flexibility, rather than treating an authorisation as an unconditional price guarantee.
What daily execution records reveal about absorption
The formal records for Samsung’s 29 trading days and SK hynix’s 34 trading days allow a move from general claims of reduced buybacks to actual quantities and amounts. Samsung’s result disclosure lists shares acquired and spending for each day; SK hynix’s daily KRX tables list actual acquisitions, spending and cumulative quantities. The comparisons below concern these two specific programmes. They do not describe every future repurchase by either company or buying across the whole market. [1] [2]
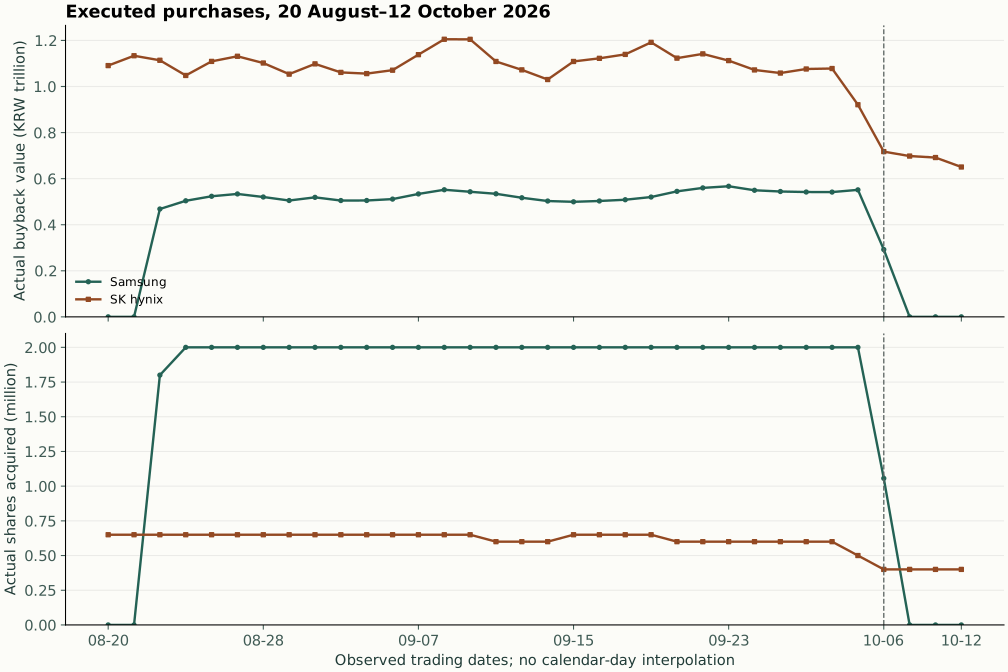
On 1 October, combined daily spending under the two programmes was approximately KRW 1.6197 trillion. On 6 October it was approximately KRW 1.0095 trillion, comprising approximately KRW 0.2922 trillion for Samsung and KRW 0.7173 trillion for SK hynix. On 12 October, Samsung made no further acquisitions under this programme, while SK hynix spent approximately KRW 0.6505 trillion. Relative to 1 October, the known programmes’ combined actual spending on 12 October was approximately 59.84% lower. This is an execution comparison between specified dates, not an estimate of the index decline caused by a change in buybacks.
SK hynix’s daily quantity fell from an early 650,000 shares to a recent 400,000 shares, a decrease of approximately 38.46%. Its purchases on 6, 7, 8 and 12 October were each 400,000 shares. Even with an unchanged share count, spending varies with the acquisition price: a falling share price reduces the cost of acquiring the same quantity. It would therefore be incorrect to attribute the entire reduction in spending to a deliberate budget cut, or infer management expectations directly from the quantity path.
By 12 October, SK hynix had acquired 20,450,000 shares, approximately 84.96% of the authorised indicative quantity. Cumulative spending of approximately KRW 35.7296 trillion was approximately 89.31% of the planned amount. The difference of approximately 4.35 percentage points between quantity and spending progress reflects, at least in part, execution prices differing from the authorisation’s reference price. The remaining budget difference of approximately KRW 4.2748 trillion does not establish a completion date. Subsequent prices, daily applications and programme adjustments still affect progress. [8] [2]
These observations support a more specific hypothesis: the market initially received execution demand from both companies; Samsung then ceased purchasing, and SK hynix reduced its daily quantity, materially lowering known absorption relative to earlier dates. They do not support the statements that both companies have finished or that no buyers remain. SK hynix’s approximately KRW 0.6505 trillion of purchases on 12 October coexisted with a falling share price, showing that buybacks and other selling pressure were present together. “Support” should not imply unlimited demand.
Average and marginal demand should also be separated. Samsung’s full-programme average daily spending was approximately KRW 0.5172 trillion, and SK hynix’s 34-day average approximately KRW 1.0509 trillion. Actual spending on a particular day is more relevant to that day’s demand than a longer-period average. Adding the two averages to estimate a 13 October shortfall mixes dates and execution schedules. The chart uses observed daily amounts. A zero after Samsung’s final purchase means only that this specific programme made no further acquisitions, not that the entire company had no other activity.
SK hynix’s daily tables display spending in thousands of won. Converting and summing all 34 observations yields KRW 35,729,554,419,000, compared with officially reported cumulative spending of KRW 35,729,554,409,000: a difference of KRW 10,000. Economically negligible, this discrepancy should nevertheless remain visible in the calculation convention. Budget progress uses the official cumulative figure; the daily chart uses the amounts displayed in the original tables. Differences in source precision are no reason to adjust one day’s execution value to obtain a neat total.
The execution series strengthens the evidence for weaker absorption, but daily total turnover in each stock and intraday execution times are still missing. We cannot report buyback participation rates or impact coefficients. Useful further data would align these formal purchasing amounts with individual-stock turnover, order books and comparison groups to test whether the price response to similar selling pressure changed. More commentary repeating the same hypothesis would add less information.
On narrow screens, scroll the table horizontally. Keyboard users can focus it and use the arrow keys.
| Trading date | Samsung | SK hynix | Combined |
|---|---|---|---|
| 2026-10-01 | 0.5417 | 1.0781 | 1.6197 |
| 2026-10-02 | 0.5513 | 0.9208 | 1.4721 |
| 2026-10-06 | 0.2922 | 0.7173 | 1.0095 |
| 2026-10-07 | 0.0000 | 0.6980 | 0.6980 |
| 2026-10-08 | 0.0000 | 0.6915 | 0.6915 |
| 2026-10-12 | 0.0000 | 0.6505 | 0.6505 |
How reduced marginal buying can amplify a price adjustment
Every completed share trade has both a buyer and a seller, so “there are no buyers” is not a precise description of executed transactions. The relevant questions are how much executable demand is continuously available near the previous quote, and how quickly sellers want to transact. If a relatively steady corporate buyer disappears, other buyers may require a lower price to absorb the same quantity.
The change may appear as lower order-book depth, slower quote replenishment, marketable sell orders crossing more price levels, or sellers accepting larger discounts to complete trades quickly. High turnover does not guarantee ample liquidity: a large quantity changing hands at worse prices can entail high execution costs. A temporarily narrow spread likewise does not ensure that a larger order can execute at the best quote. Quantity, time and replenishment speed need to be observed alongside spreads.
Order-book research links short-horizon price changes to order-flow imbalance generated jointly by limit orders, marketable orders and cancellations, with impact related to market depth. This helps explain why similar selling quantities can produce different price changes on days with different absorption capacity. It does not provide a ready-made regression coefficient for today’s Korean market. Applying a historical paper’s coefficient or average relationship directly to today’s aggregate net sales would be an unestimated transfer of a model. [11]
Consider a purely illustrative comparison. Sellers seek to dispose of the same value within an hour. In one case, limit buyers continually replenish their orders; in another, uncertainty prompts buyers to lower their quotes and reduce displayed size. Prices may move further in the second case even if sellers do not increase quantity. A completed corporate buyback may remove one steady source of absorption, while competition news lowers other buyers’ willingness to pay. The two effects can reinforce one another.
Passive demand should not be assumed to provide automatic support. Index funds respond to subscriptions and redemptions, cash management and rebalancing rules; a falling stock does not necessarily attract new external inflows. Some long-term investors may allocate more at lower valuations, but budgets, investment committees and risk limits determine their response speed. Short-term selling pressure and a longer-term case for ownership can remain mismatched for days or longer.
An empirical test would examine the company’s buyback participation rate, price displacement for comparable aggressive selling, best-quote quantities and replenishment rates before and after completion, ideally controlling for peer performance and market volatility. A marked deterioration with little change in earnings information would strengthen a liquidity explanation. Stable depth alongside a coordinated valuation decline among related companies would give more weight to information repricing.
“Reduced marginal buying” should therefore be a judgment about price elasticity and execution conditions, rather than rhetoric about money disappearing from the entire market. It may explain why prices fall faster, but generally cannot independently explain why investors want to sell at this particular moment. Separating motivation from absorption is more informative than attributing every issue to insufficient funds.
What foreign net selling does and does not establish
KOSPI cash-equity classifications at 11:47 on 13 October showed foreign net selling of approximately KRW 2.7933 trillion, individual net buying of approximately KRW 1.6955 trillion and institutional net buying of approximately KRW 0.8122 trillion. Individuals and institutions together bought a net KRW 2.5077 trillion. These three categories do not cover all accounts, and the residual of approximately KRW 0.2856 trillion cannot be identified directly as corporate buybacks. A statistical residual is not an account-identity test. [3]
Media reports after the previous close differ on the precise foreign net-selling amount, while approximately KRW 2 trillion is a broadly consistent order of magnitude. Intraday comparisons should preserve the same classification and observation time rather than averaging media figures to produce a smoother chart. Trading news is useful for describing immediate pressure. Attribution over several months requires more exacting treatment of original tables, settlement conventions and statistical coverage. [6] [12]
One plausible reason for continued foreign selling is weight and risk rebalancing. A portfolio that benefited from rising memory shares may have acquired a larger exposure without buying more; reducing that weight need not mean anticipating an operating crisis. A second motive is weaker expected profits, and a third is client redemptions or changes in cross-asset opportunity costs. Their implications for subsequent markets differ, although all can generate the same net-selling figure.
The distinction between active and passive transactions also matters. If selling predominantly reflects active funds’ reassessment of an industry cycle, future earnings guidance and competition may govern their return. If it mainly reflects redemptions and mechanical risk reduction, pressure may ease when flows stabilise even without new fundamental information. The category label “foreign” alone cannot establish that distinction.
Net selling is not gross selling, nor does it mean that foreign investors made no purchases. A net amount subtracts sales from purchases; a net-selling category can contain substantial rotations and opposing trades. The same institution may sell Samsung while buying other Korean companies, or adjust cash and futures risk in opposite directions. Aggregation compresses this investor heterogeneity.
Further research should ask whether foreign selling in Samsung and SK hynix exceeded selling in other large Korean exporters; whether it concentrated in high-volatility periods; and whether it coincided with US memory stocks, global AI portfolios or client redemptions. Strong concentration in the two producers would increase the relevance of industry exposure and crowded holdings. Broad, persistent reductions across sectors would require more attention to country risk, exchange rates and global asset allocation.
Individual net buying should not be given an automatic positive or negative interpretation either. It can represent long-term allocation at lower prices, additions to leveraged positions or short-term speculation. Institutions switching from net selling the previous day to net buying during the morning show a changing absorption structure, not necessarily a stable market. Stability depends on whether further selling is absorbed at lower prices and whether quotes and risk budgets recover, rather than on one investor category prevailing over another.
On narrow screens, scroll the table horizontally. Keyboard users can focus it and use the arrow keys.
| Investor category | Net purchases |
|---|---|
| Foreign | -2.7933 |
| Retail | +1.6955 |
| Institutional | +0.8122 |
| Unlisted-category arithmetic residual | +0.2856 |
Distinguishing equity transactions from cross-border capital flows
Equating foreign cash-equity net selling with capital leaving Korea is a common but substantive error. Sale proceeds may remain in won cash, Korean bonds, deposits or other securities, and investors may maintain currency hedges. Equity execution, securities settlement, currency conversion and cross-border remittance are distinct stages. Establishing that funds left the domestic asset system requires observing those stages together.
The Bank of Korea’s 17 September report on international financial and foreign-exchange markets since August provides a direct example of measurement differences. Its August equity flow was −USD 8.66 billion on a trade-date basis, but +USD 0.04 billion on a securities-fund settlement-date basis. The relevant statistics cover listed-share exchange and off-exchange transactions and IPOs, exclude ETFs, ELWs and ETNs, and use Bank of Korea settlement-date estimates. These two timing conventions are not interchangeable. [13]
The official summary of the Financial Supervisory Service’s August securities-investment release separately reports foreign net purchases of listed equities of KRW 0.344 trillion, net recovery of bond investment of KRW 4.736 trillion, and net recovery across securities of KRW 4.392 trillion. A month can therefore have both net equity buying and aggregate securities-fund recovery. The latter is not itself a record of currency conversion or cross-border remittance. Calling it an equity withdrawal mixes asset classes; directly adding won and dollar amounts also mixes currencies. [14]
These releases show why a narrative of several consecutive months of foreign selling needs fuller reconciliation than a few headlines. Trade-date and settlement-date figures can indeed have opposite signs, but that general fact does not reconcile every monthly or year-to-date media total. Long-period aggregates that cannot be consistently verified in this edition are not used as precise causal evidence. Intraday cash-equity selling pressure and cross-border capital movement are separate questions.
Exchange rates provide another counterexample. At 15:30 on 12 October, USD/KRW was 1,335.1, down KRW 7.7 from the preceding observation, meaning the won appreciated. Korean shares fell substantially and foreign investors remained net sellers on the same day. Equity weakness can coexist with currency strength through broad dollar movements, exporters’ conversion of receipts, bond flows, hedging and other demand. This contradicts the simple one-way claim that foreign equity selling must depreciate the won; it does not independently prove that no funds were remitted abroad. [4]
Returns for overseas investors also need a stated reporting currency. If X denotes the USD/KRW quote in won per dollar, an unhedged Korean stock’s dollar-denominated price return is the ending-to-starting stock-price ratio multiplied by starting X divided by ending X, minus one, excluding dividends and taxes. Won appreciation can reduce the dollar-denominated equity loss; depreciation can increase it. Hedged portfolios additionally require forward or swap gains and losses. The unhedged formula cannot be applied to every foreign account.
A reasonable sequence for foreign-flow research is to verify transaction net amounts first, then distinguish shareholding quantities from their market values, examine settlement funds and currency hedges, and only then discuss cross-border withdrawal. A lower holding value may result from a lower price rather than sales of the same amount. These layers should remain separate, with statistical definitions taking precedence over dramatic language such as “capital flight”.
How index concentration changes Korean market risk
The KOSPI uses a market-capitalisation-based calculation, making common moves in large constituents important to the aggregate index. [15] Research must nevertheless distinguish the KOSPI from the KOSPI200, ordinary from preferred shares, and the treatment of free float. The two companies’ share of total market capitalisation at a historical date cannot replace an exact calculation of their contribution to the KOSPI on 13 October. KOSPI200 weights cannot simply be copied into the broader index.
In a simplified capitalisation-weighted portfolio, a single-period return can be approximated by the sum of each constituent’s return multiplied by its preceding weight. Two large companies with correlated returns can leave an apparently broad index exposed to a concentrated set of industry shocks. The number of securities and the number of distinct economic risks are different concepts. Owning many Korean stocks does not automatically provide adequate diversification beyond the memory cycle.
Concentration also creates flow feedback. Global investors may initially reduce Korean exposure through country ETFs, index futures or index swaps, with dealers’ hedges transmitting that change to large constituents. In the opposite direction, falling memory shares depress the index, affecting the risk and investor flows of index-tracking portfolios. This two-way channel couples country allocation to industry views. Index trading and single-stock trading are not fully independent sources of pressure.
The KOSDAQ’s substantial decline on the morning of 13 October shows that pressure was not confined to the arithmetic contribution of two large stocks. It may reflect growth duration, risk appetite and leverage constraints, alongside its constituents’ own industry news. Identifying breadth requires advancing and declining counts, equal-weighted indices, median returns and a portfolio excluding the two companies. The KOSDAQ’s fall provides a directional indication of broader pressure, not a complete breadth analysis.
A useful comparison separates Korean memory producers, other Korean export manufacturers, domestic-demand industries and overseas memory companies. Weakness confined to Korean memory would make domestic absorption and specific competitive exposures more important. Synchronous weakness across global memory would give more weight to industry valuation and end demand. Broad Korean underperformance against overseas markets would warrant further investigation of country risk and local funding conditions. Comparison groups should follow economic exposure rather than be selected from the day’s smallest decliners.
This edition does not report a percentage of the total decline attributable to semiconductors without contemporaneous weights. The directional relevance of concentration remains clear. The distinction is between arithmetic contribution and economic explanation: even an exact number of index points contributed by two stocks would not explain why they fell, or whether other shares were affected by the same shock.
For longer-term allocation, the event highlights a risk-budget issue. Country weights, industry weights, customer demand and technical roadmaps may all point to a common AI-memory factor. Nominal diversification across companies can fail to deliver its expected benefit under stress when earnings drivers are similar. Risk management should examine common drivers, not merely count security identifiers.
Interpreting CXMT’s progress within memory competition
Competitive news can affect valuations quickly because markets price future supply, not only revenue already earned. CXMT officially announced mass production of its fifth-generation DRAM platform, G5, on 20 September. Reporting from a 10 October industry event described a next-generation DDR5 RDIMM plan using a 4F² architecture, VSG transistors and hybrid bonding, with a launch expected by year-end. A platform already announced as in mass production and a specific product still on a roadmap must be described separately. [16] [17]
DDR5 RDIMMs are server-memory modules. HBM is a different class of memory, with substantially different bandwidth, packaging and system-interface requirements. Progress in DDR5 competition may change server-memory supply, pricing and incumbent capital allocation. It does not directly establish high-end HBM customer qualification or the replacement of Samsung or SK hynix HBM orders. [18]
Several hurdles separate a technical roadmap from an economic outcome: a functioning design, a stable manufacturing process, economically acceptable yields, customer qualification, sufficient supply scale, and orders won at sustainable prices. A smaller memory-cell area can improve theoretical density, but peripheral circuitry, redundancy, testing, packaging and yield affect the whole chip’s cost. A percentage reduction in cell area is not automatically the same percentage reduction in finished-product cost.
If new supply first enters general-purpose DRAM, effects may transmit through substitution and capacity reallocation. Incumbents may devote more resources to higher-value products or change general-purpose pricing and contracts. Even without immediate substitution in HBM, general-purpose DRAM margins affect aggregate cash flow, capital expenditure and competitive pricing responses. “It is not HBM, so it has no effect” is also too simple.
Server customers’ qualification cycles, long-term reliability requirements, supply assurance and system compatibility have economic value. Publishing product specifications does not mean that every customer can quickly switch supplier. Research should follow qualification progress, actual shipments, customer coverage and revenue contribution, rather than assess competitive position solely through launch-event performance claims. Markets may price the possibility early, while industrial outcomes develop over several quarters.
This explains why shares can fall while reported profits remain high. If investors previously expected elevated margins for many years and additional supply reduces the credibility of that assumption, the present value of the profit path falls even if the latest quarter is unchanged. Prices may reflect a shorter expected period of exceptional profitability rather than a sudden disappearance of current revenue.
Our view is that CXMT’s progress belongs in continuing supply-competition research. Its potential implications for general-purpose DRAM and server modules have a stronger evidential foundation than a claim that it has already replaced HBM. For Korean producers, the questions are whether technical leadership converts into durable qualification, contracts and cost advantages, and whether expansion preserves profitability discipline. These are material questions, but the current roadmap does not establish a reversal of industry leadership.
Why strong profits do not guarantee stable share prices
Samsung’s preliminary third-quarter guidance of 8 October gave midpoints of KRW 195 trillion in revenue and KRW 107.4 trillion in operating profit. It indicates recent operating scale and profitability, but remains preliminary guidance, not segment cash-flow information newly released on 13 October. There is no mechanical one-to-one relationship between the latest profits and the direction of the share price. [19]
SK hynix’s second-quarter release reports revenue of KRW 79.3187 trillion, operating profit of KRW 60.5426 trillion and net cash of KRW 69.4 trillion. It describes volume shipments of HBM4 and capacity arrangements based on demand, while identifying the figures as preliminary and not yet independently audited. This is important counterevidence to claims of immediate operating weakness. Treating a large net-profit figure indiscriminately as sustainable operating earnings, or capacity arrangements as a guarantee of future demand, would overstate what one quarterly release establishes. [20]
A simple valuation identity expresses price as earnings per share multiplied by the earnings multiple investors are willing to pay. If earnings rise 20% but the multiple falls 25%, price still falls 10%. This is an illustration, not an estimate of either company’s current valuation. Investors consider not only the earnings level, but its sources, durability, further capital requirements and the risk compensation they require for the next phase.
In cyclical industries, a low price-to-earnings ratio can reflect an expectation that current earnings are near a peak, or genuine undervaluation. Distinguishing them requires normalised earnings and cash flows, not only the last four quarters. Margins substantially above sustainable levels can make a valuation based on current profits appear unusually low. That low multiple may disappear as earnings normalise.
Repurchases reduce shares outstanding while also reducing cash assets. Treasury shares are already excluded from the weighted-average shares used for basic earnings per share while held; subsequent cancellation should not be counted as another EPS uplift. [21] Sensibly priced repurchases can improve remaining shareholders’ long-term returns, but a lower share-count denominator cannot repair a loss of operating value if the purchase price embeds excessive cyclical expectations. Employee awards also require consideration of the eventual redelivery of those shares.
A third dimension is capital expenditure and depreciation. Strong present demand can prompt substantial spending on equipment and plants, creating higher fixed costs and depreciation later. Marginal returns may fall even while total revenue grows. Investors are reassessing what future incremental capital can earn, not only what existing facilities earned during a supply shortage.
Subsequent earnings analysis should therefore combine current profits, next-quarter demand, longer-term supply, cash recovery and capital discipline. Stable customer commitments, durable qualification barriers and profits converting to free cash flow would strengthen long-term value evidence. Growth increasingly dependent on aggressive expansion, price concessions or short-term orders would make current high profitability less supportive of the previous valuation.
Capital structure and governance expectations may also affect SK hynix’s relative valuation. In its 1 October clarification of Solidigm’s capital arrangements, the company stated that no decision had been made, that internal and external financing were both being assessed, and that long-term corporate and shareholder value was the principal criterion. External financing may provide investment resources while changing expectations about the cash flows attributable to parent-company shareholders. Its effect depends on financing valuation, the proportion of newly issued equity, use of proceeds and governance terms. Without a transaction structure, a potential listing cannot be treated as a certain loss of value. The issue predates this sell-off and is a background consideration for valuation, rather than an identified new trigger on 13 October. [31]
Studying AI investment demand alongside end-market cash recovery
Korean memory demand is connected to global AI infrastructure construction, but high capital expenditure and high returns on that expenditure are separate propositions. Construction produces equipment, server and memory orders, with suppliers recognising revenue relatively early. Cloud and application businesses must deploy capacity, raise utilisation and collect customer payments before investment produces recurring cash returns. Upstream prosperity and downstream cash-recovery pressure can coexist.
Microsoft’s 29 July quarterly earnings call reported approximately USD 41 billion in capital expenditure, USD 55.4 billion in operating cash flow and USD 19.6 billion in free cash flow, distinguishing cash property-and-equipment investment from finance leases. Meta’s contemporaneous release reported capital expenditure including finance-lease principal of approximately USD 31.08 billion, operating cash flow of approximately USD 31.862 billion and free cash flow of approximately USD 0.784 billion. These are prior-quarter background observations, not demand contractions newly occurring on 13 October. [22] [23]
The figures support analysis of investment intensity and the timing of cash recovery, not a simple comparison of the companies’ “AI returns”. Their business mixes, accounting definitions, leasing practices and construction schedules differ, and capital expenditure is not all memory procurement. Low quarterly free cash flow can reflect concentrated project payments. Persistence requires observations of revenue, utilisation and cash over multiple periods. Annualising one quarter risks mistaking project timing for a long-run economic outcome.
Capital-expenditure headlines also require consistent definitions. Microsoft revised its calendar-year 2026 expectation from approximately USD 190 billion to USD 175 billion, explaining a classification adjustment involving certain future data-centre leases rather than a corresponding reduction in underlying expected investment. Describing the headline reduction alone as a collapse in AI construction demand would confuse an accounting presentation change with a real demand change. [22]
Memory’s long-term value depends on whether installed and planned computing capacity is used effectively, whether customers purchase services at sustainable prices, and whether utilisation covers depreciation, energy and financing costs. Insufficient application revenue could slow the next expansion phase and shorten expected order duration. Realised productivity and revenue, conversely, could justify high upfront cash spending. Neither path can be established from one popular product or one total-capex figure.
Demand should not be double-counted along the value chain. The same data-centre project can appear in a cloud company’s capital expenditure, an equipment supplier’s order book and a memory producer’s expectations. These are stages of the same construction project, not three independent sources of final demand that can be added together. If suppliers all expand on the same optimistic outlook, capacity may also arrive together after demand normalises.
Our view is that continued interest in AI’s long-term applications is consistent with caution about a particular company’s current price. Technology adoption, infrastructure-investment timing, the distribution of supplier profits and equity valuation require connected but distinct analyses. A correct long-term technological direction does not ensure attractive capital returns at every stage, price or investment date.
Overseas price signals and the sequence of local trading
US semiconductor performance is important background information for Korea, but the specific trading sessions must first be verified. Nasdaq’s fixed historical series records SOX closes of 12,623.71 on 8 October, 12,572.42 on 9 October and 12,236.79 on 12 October. Adjacent-close returns are approximately −0.41% on 9 October and −2.67% on 12 October. The latter US session had concluded before Korea opened on 13 October. [24]
The 13 October Korean session therefore faced further preceding US semiconductor weakness. The US close on 12 October cannot explain the Korean closing decline that had already occurred on 12 October. Intraday lows or returns from a different overseas date cannot be described as the preceding US session’s closing performance. Exchange time zones, holidays and the sequence of closes are indispensable variables in event analysis.
Overseas prices also represent different economic exposures. SOX includes design, equipment, manufacturing and other semiconductor businesses, whereas the two Korean producers are concentrated in particular memory products and customer chains. Interest rates, multiple compression and constituent-specific news may affect the index without mapping entirely to memory demand. Estimating transmission would require additional comparisons with Micron, memory-equipment companies and relevant AI customers, rather than treating a broad index as the full industry evidence.
CXMT’s event information of 10 October emerged over the weekend, giving Korea its first trading opportunity to incorporate it on 12 October. Subsequent overseas reporting and US trading could further update risk assessments. This sequence provides a plausible chain connecting competitive information and global prices, but temporal overlap alone cannot identify an independent monetary news impact. The amount of genuinely new information relative to previously known technical progress determines the potential repricing.
A stronger intraday design would distinguish the opening gap, continuous trading and closing auction, aligning each with new-information timestamps, corporate execution and risk-hedging windows. Opening weakness may reflect accumulated overnight information; continued intraday weakness may reflect insufficient absorption, persistent sales or new news; unusual closing behaviour may involve rebalancing. A closing return alone cannot identify these three patterns.
We currently regard overseas semiconductor weakness as external pressure on the second declining session, with Korean buybacks and flow structures determining its absorption. External information and local buying capacity are complementary explanations. A market may fall in response to shared industry news and move more sharply because of local concentration and liquidity conditions.
Leveraged products may amplify moves, but need contemporaneous evidence
Leveraged ETFs typically target a multiple of daily returns and adjust exposure to maintain that leverage. After an asset-price move, fund net asset value and existing risk exposure change by different amounts, generating rebalancing demand. For a simplified constant-leverage portfolio without subscriptions, redemptions, fees or other cash flows, that demand is L×(L−1)×A×r, where A is the preceding day’s asset value and r is the underlying return. The formula describes a structure, not today’s selling amount. [25]
In a purely illustrative two-times long portfolio, starting net assets are 100 and exposure is 200. After the underlying falls 10%, net assets become 80 while the existing exposure is worth 180. Restoring two-times leverage requires target exposure of 160, a reduction of 20. An underlying gain requires the opposite, an increase in exposure. This adjustment in the direction of the day’s move can amplify volatility when execution is concentrated.
A daily minus-one-times inverse product also has a similar trend-following rebalancing component. It does not follow that every bearish product buys on a falling day and supplies a buffer. Target leverage, changes in net assets and investor flows jointly determine final demand. Cash securities, futures, swaps and dealer hedging need not transmit one-for-one or immediately into visible trades in the same stock.
The BIS’s September 2026 feature directly examines leveraged products linked to Samsung, SK hynix and Micron. Their combined assets peaked above USD 38 billion in June; its historical model associated a 10% SK hynix price move with close to USD 5 billion of rebalancing demand. This establishes the relevance of the risk to Korean market research. Its assets and sample window belong to an earlier period and cannot calculate actual mechanical selling on 13 October. [26]
Subscriptions and redemptions can increase or offset this demand. Federal Reserve research finds that including investor flows can substantially reduce estimated mechanical rebalancing. [27] In the two-times long example, net subscriptions increase fund assets and may partially offset deleveraging sales, while redemptions may add to selling pressure. Flow effects for inverse products differ and cannot be assigned the same conclusion. Dealers may also hedge in advance or at different times, making final effects depart from the simplest formula.
Calling leveraged products a proven central cause today would require, at minimum, product assets before the observation cutoff, target leverage, same-day investor flows, hedging contracts and execution records. The more accurate assessment is that they are a potential amplifier supported by research and institutional design, with their event-specific contribution still unverified. A rapid decline alone does not establish forced liquidation, and a model estimate is not a record of executed sell orders.
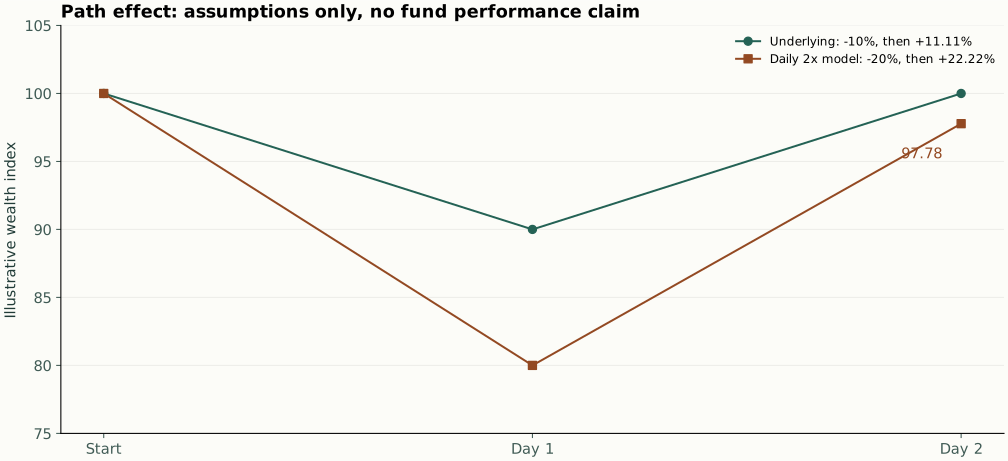
Leverage also creates path dependence. An underlying falling 10% and then rising 11.11% returns approximately to its starting value. A fee-free two-times daily product first loses 20% and then gains 22.22%, remaining approximately 2.22% below its starting value. This illustration distinguishes daily return multiples from multi-day cumulative multiples; it describes no specific product’s actual performance today. Both the return path and its endpoint matter.
Feedback from risk budgets and trading mechanisms
Falling prices themselves change many portfolios’ risk states. Volatility-targeting strategies may reduce exposure as volatility rises, margin accounts may need additional collateral, options dealers may rehedge changing positions, and funds meeting redemptions may need cash. Their common feature is trading demand driven partly by constraints rather than solely by new judgments of company value.
Each mechanism nevertheless requires its own evidence. Volatility-targeting portfolios may not own the relevant stocks; margin shortfalls may not meet forced-sale thresholds; option-hedging direction depends on dealers’ net positions, not simply on a falling share price. Labelling every rapid decline a programme-trading stampede hides the accounts, rules and quantities that need verification.
Reporting records a sell-side Sidecar trigger at 9:47 on 13 October. [5] KRX rules temporarily restrict the effectiveness of relevant-direction programme-trading quotations for five minutes after the corresponding futures move reaches the specified threshold for one minute. This does not halt trading across the whole equity market. Ordinary stock trading and a market-wide circuit breaker have different scopes. [28]
Market-wide circuit breakers have separate staged decline thresholds of 8%, 15% and 20%, with the initial stage involving a broader trading suspension. [29] A Sidecar does not establish that a market-wide circuit breaker has occurred, nor is it an obligatory preceding stage. A trading restriction shows that a rule threshold was reached. It does not establish that the triggered mechanism caused the decline preceding it.
These rules principally provide time to reorganise quotations and assessments. They create neither a permanent buyer nor a change in corporate cash flows. Stability after a pause still depends on buying and selling intentions, risk constraints and new information. Interpreting a trigger as proof that policy has supported prices, or that all transactions are impossible, misreads the mechanism.
Subsequent liquidity tests should compare quote depth, trading speed and cash-futures basis before and after a restriction. Risk-budget tests should examine product flows and synchronised reductions across markets. Selling concentrated near the close and accompanied by product hedges would strengthen a mechanical explanation. Progressive repricing across markets throughout the day, with lower earnings expectations, would strengthen a fundamental explanation.
Risk mechanisms connect information to prices. Fundamentals need not deteriorate by a matching proportion in a few minutes for equities to fall quickly: portfolios may need to find buyers within a limited time. Recognising that distinction reduces emotive language and brings research closer to actual trading processes.
How exchange rates, interest rates and macro risks enter the assessment
Macro variables affect equities primarily through discount rates, foreign-currency returns, funding costs and final demand. Higher long-term rates increase the discounting of distant cash flows; broad dollar changes affect unhedged foreign-investor returns; energy and supply-chain shocks can change data-centre and manufacturing costs. These are plausible economic channels. Establishing them as today’s causes requires observations at the same time and reactions in related assets.
This edition assigns no specific causal share to oil prices, government-bond yields or geopolitical news that have not been consistently verified. A persistent global background risk does not automatically explain a sudden move on one day. An event-time price adjustment is more plausibly connected to newly emerging risk, changing probability or altered trading constraints.
Currencies and shares can move together or in opposite directions. Exporters’ won profits are sensitive to exchange rates, but costs, overseas expenditure and hedges alter the result. Won appreciation need not hurt dollar investors, although it may reduce the domestic-currency translation of some export receipts. These effects cannot be reduced to “a stronger won must lift stocks” or “a weaker won must benefit exporters”.
Macro analysis also distinguishes economic data levels from surprises relative to expectations. Strong data can still produce a negative reaction if below prior expectations. Similarly, rising rates may reflect improving growth or a higher risk premium. The direction of a variable alone does not classify it mechanically as positive or negative.
A stronger procedure fixes common time series for the dollar, rates, memory equities and country indices, then compares unusual changes within the event window. Korean memory losses exceeding the variation normally associated with common factors would make local flows and particular competitive information more relevant. If common factors already account for most synchronous moves, the remainder should not automatically be assigned to buybacks.
Our current assessment treats macro conditions as conditioning variables rather than an unverified main trigger. This does not mean macro is unimportant. It avoids replacing testable explanations with an all-purpose narrative when consistent event data are absent. Clear subsequent cross-asset stress would justify increasing the framework’s emphasis on macro factors.
Evidence strength and tests for the competing explanations
The factual basis for a weaker buyback buffer is the clearest: Samsung’s final purchase has passed, while SK hynix continues purchasing at a lower recent daily quantity than early in its programme. This explanation predicts more price sensitivity to comparable selling pressure and possible changes in trading participation and order-book absorption after purchases cease. If depth, trading impact and relative peer performance show no material change, confidence in buyback completion as a major amplifier should fall.
Foreign cash-equity net selling has direct contemporaneous transaction evidence. Deliberate risk reduction is one possible motive. A flow explanation predicts pressure on related stocks and index hedges while selling persists. If foreign investors resume net buying while prices continue to weaken, fundamentals deserve greater emphasis. If net selling ceases and quotations recover rapidly without changed operating expectations, flows become more informative. The act of net selling does not itself establish investment motivation.
Memory-supply competition has a foundation in official technical disclosures and product roadmaps. It predicts greater attention to general-purpose DRAM price expectations, customer qualification and long-term gross-margin assumptions. Without subsequent meaningful shipments, customer coverage or a cost advantage, the market may revise its early extrapolation. Delivery of those outcomes would make the present risk discount more consistent with genuine industrial change.
Reassessment of AI investment returns is important background, but not a separately identified new 13 October announcement in this edition. It predicts a shift in focus from construction spending alone to utilisation, revenue conversion and incremental returns on capital. Improving end-market revenue and cash recovery could ease valuation pressure. Continuing order growth dependent on high spending without clear recovery could raise the required risk premium further.
Leverage and risk feedback have established mechanisms and Korea-related historical research, but lack complete execution evidence for today. They predict mechanical trades concentrated in risk-adjustment and rebalancing windows, with demand related to product assets. Subscriptions that materially offset demand, or small positions, would reduce the explanatory force of a simple amplification model. Every explanation must remain open to being weakened by data.
Index concentration is a structural condition, not new information each day. It predicts larger aggregate moves when large constituents move together; the test uses accurate preceding-day weights and return contributions. It helps explain why the aggregate index fell substantially, but does not fully explain why the two companies became weaker. Separating structural risk from the day’s trigger avoids a circular explanation.
This ranking assigns no invented probabilities or shares of the decline. Evidence strength describes the level currently established, not a statistical confidence interval. Expressing explanations as testable predictions gives subsequent editions a substantive direction for updating, rather than replacing one narrative after every move while continuing to claim confirmation.
Our current assessment and the conditions that would change it
Our first view is that fading buyback demand merits serious analysis but cannot independently explain the entire decline. It resembles the temporary removal of a relatively price-insensitive buyer, making adjustment to new information easier. SK hynix’s continued execution directly contradicts a claim that both corporate buyers have disappeared. Samsung’s employee-award purpose also shows that short-term purchase orders and permanent shareholder distributions are not identical.
Second, the event cannot be understood solely as a flow problem. CXMT’s roadmap and global semiconductor prices give investors reason to reassess the duration of memory profits. Competition and capital returns remain relevant even after temporary selling eases. Conversely, a product plan is not mature supply, and large share-price volatility does not establish that incumbent leaders have lost their core customers.
Third, risk identification in Korea needs to move from country diversification to diversification of economic drivers. Portfolios concentrated in AI-memory exposure may share demand and valuation factors despite owning different securities, products and listing markets. The relationship between these common drivers and trading constraints is more transferable to other markets than a particular Korean index level.
Fourth, evidence of stability should involve several improving indicators. A one-day rebound may reflect position covering, corporate execution or a temporary recovery in risk budgets. A single day of foreign net buying need not mark the return of long-term allocation. Simultaneously improving quote depth, trading impact, flows and earnings expectations would provide stronger evidence. A price rebound alone, with absorption and expectations still deteriorating, would remain a fragile recovery.
These views will change with information. If absorption remains stable after SK hynix completes its programme, competitive products advance slowly, and customer contracts and cash recovery continue to deliver, the case for lasting damage from buyback completion should weaken. Persistent simultaneous risk reduction by foreign and domestic institutions, material new supply reaching customers and lower normalised-profit expectations would make a purely liquidity-based account less adequate than a more durable valuation adjustment.
We infer no trading entry point, price target or short-term rebound probability from this evidence. It supports analysis of risk sources and the conditions under which they persist, not judgments about any reader’s assets, leverage or capacity to absorb losses. A clear view need not become a trade instruction. Stating what would change the view is often more useful than a price unsupported by a model.
Three conditional scenarios
In the first scenario, flow pressure gradually subsides while earnings expectations hold. Other investors absorb the demand gap after buybacks end, foreign net selling slows, and product flows and risk budgets stabilise. Prices may stabilise without significant positive news because selling previously exceeded the speed of absorption. The relevant tests are flows, quotes and unusual volatility over several sessions, not a single rebound day.
In the second scenario, absorption recovers but earnings durability continues to be reassessed. Lower selling pressure improves execution conditions without restoring the previous assumption of many years of exceptional profits. Volatility may ease while the valuation range remains lower. Reduced trading impact alongside falling normalised-profit expectations or long-term multiples would characterise this case. It distinguishes liquidity repair from a restoration of fundamental value assessments.
In the third scenario, fundamental concerns and trading constraints continue to reinforce each other. Advancing new supply, end-market cash-recovery pressure and redemptions coexist, with absorption weakening further as perceived risk rises. Lower prices need not immediately attract enough capital while investors remain uncertain about both earnings and potential selling. Volatility may persist, and risk analysis needs multi-day paths rather than one-day returns alone.
No numerical probabilities are assigned to these scenarios. Without adequate historical samples, product positions and repeated events, a claim of a 60% or 70% likelihood would manufacture precision. Scenarios define in advance which observations support which explanation, keeping updates consistent instead of portraying every outcome as a successful prediction.
Transitions are possible. Flows may repair before industry news deteriorates further; competitive concerns may ease while redemptions continue. Research should retain these changes of state instead of reducing the market to immediate recovery or permanent collapse. Industry and trading cycles need not be synchronised.
The research value of studying a volatile episode therefore extends beyond predicting direction. It creates a reusable observation sequence: establish data and timing, verify marginal buyers, assess earnings expectations, and examine risk feedback. Preserving that sequence is more robust than rebuilding an entire market worldview around each new headline.
Data priorities for subsequent observations
Closing prices provide a full-session endpoint for this event, but complete exchange investor classifications, market breadth, daily highs and lows, turnover and auction records remain necessary. News estimates of full-day flows may differ from official classifications, and discrete price observations do not reconstruct the entire trading path. Additional records should test absorption, investor direction and earnings expectations separately, without interpreting recovery from an intraday observation to the close as evidence that risk has subsided.
Second, follow actual buyback execution and subsequent arrangements at both companies. Daily applications, actual acquisitions, cumulative share counts, cumulative amounts and ultimate uses serve different purposes. SK hynix’s smaller daily quantity may relate to budgets, price constraints or execution strategy; quantities alone do not identify management’s motive. Samsung’s later employee-share delivery and SK hynix’s cancellation should be documented through the relevant formal disclosures.
Third, establish a flow-definition crosswalk: separate cash equities from futures, transactions from settlement, equities from bonds, and won from dollars. Changes in shareholding quantities are closer to actual transaction behaviour than changes in holding values. Cross-border flows require the corresponding official funds statistics. Monthly comparisons should preserve source and definition, without silently joining faster media data to slower official releases.
Fourth, examine actual progress in memory competition. Stable production of new processes, product-level yield, customer validation, deliveries and revenue contribution are more informative about supply pressure than published specifications alone. For Samsung and SK hynix, compare product mix, contract coverage, capital expenditure and free cash flow. Management forecasts in future calls should be distinguished from realised operating figures.
Fifth, collect contemporaneous leveraged-product assets and investor flows and observe hedging execution. Target leverage and underlying returns calculate theoretical demand, not actual trades. Where assets, net subscriptions and redemptions, or dealer hedges are missing, the mechanism can be discussed but an exact contribution should remain unassigned. A historical asset peak cannot replace today’s asset value.
Finally, establish fixed comparison groups and time series. Korean memory, global memory, Korean non-memory exporters and domestic growth equities answer different questions. Where data permit, compare risk-adjusted abnormal returns and market depth. With incomplete data, use descriptive results and specify their definitions. Planned regressions or event studies should never be described as completed statistical findings.
Analytical limits and distinct forms of risk
This edition is principally an evidence-constrained event and mechanism analysis. Buyback plans, outcomes and execution records have primary-disclosure support. Some immediate prices and flow snapshots come from time-stamped news reports. Industry roadmaps combine manufacturer disclosures and event reporting. Leverage analysis draws on historical structures and research. The four source types establish different things and should not all be summarised as verified causes of today’s move.
Price discovery, liquidity and solvency are distinct risks. Prices may fall as future profit paths are reassessed; execution may become more difficult as depth declines; companies may encounter financial pressure from cash obligations. A falling share price does not establish insolvency, and abundant cash does not guarantee that prices will stop adjusting. They are analysed separately here.
The limited observations do not estimate causal shares, typical daily volatility or all industry normalised profits. The sample is one event window, with both companies closely connected to global industry information. Even fuller daily records would require care not to mistake coincident events for separately identifiable shocks. Precise description is more reliable than precise attribution without estimation.
The report examines public-market pricing and trading mechanisms, rather than any reader’s personal asset allocation. It does not disclose Unique Aurora’s positions, returns or future trading arrangements. Sources, observation times and calculation definitions are provided in the text and appendices so readers can verify the facts on which the analysis depends.
Conclusion
The most useful question in this Korean market decline is how three chains meet: a reassessment of memory-profit durability, changing marginal absorption through corporate buyback cycles, and flows and risk constraints turning information into concentrated trades. Each explains part of the observations, but none independently covers the entire event.
Samsung’s completion of this programme is a fact, as is SK hynix’s continued execution. Foreign investors’ net selling that morning is a fact; the distinction between equity sales and capital already remitted abroad is equally important. CXMT’s technical progress merits attention, but a DDR5 roadmap is not completed substitution in HBM. Strong profits and large AI expenditure describe the preceding expansion without automatically establishing how long future profits will persist.
Our interim assessment is that short-term trading fragility and medium-term earnings repricing coexist. Subsequent stability should be examined through absorption, flows, product competition and cash recovery together. A rebound or another buyback authorisation alone risks turning temporary execution improvement into a claim that long-term risk has disappeared. Conversely, one severe day of losses risks presenting unrealised competitive threats as an industrial collapse already under way.
The afternoon and closing observations further show why cumulative selling and price direction cannot be mapped one-for-one: as cumulative foreign net selling in KOSPI cash equities increased, both indices and Samsung recovered from the morning observation, while SK hynix weakened further. Further analysis should align full-day investor classifications, executed buybacks, quoted depth and earnings expectations on the same timeline, testing whether trading pressure has eased and whether the repricing reflects more persistent operating changes.
Calculation appendix and unit conventions
Price returns are calculated as ending price divided by starting price, minus one. At 11:47 on 13 October relative to the 12 October close, the KOSPI change is 5,915.81/6,384.24−1, approximately −7.3373%; the KOSDAQ change is 803.37/849.19−1, approximately −5.3957%; Samsung’s is 228,250/250,500−1, approximately −8.8822%; and SK hynix’s is 1,451,000/1,605,000−1, approximately −9.5950%. Displayed returns are rounded to two decimal places.
The event-window KOSPI change is 5,915.81/6,625.93−1, approximately −10.72%. The comparison with 7,003.74 on 2 October is approximately −15.53%. The latter starting observation is not an identified full-year peak, so it is labelled an interval price change. These two observations are not used to calculate the year’s maximum drawdown.
Samsung’s average daily buyback amount is KRW 14,999,999,899,750 divided by 29, approximately KRW 517,241,375,853, or KRW 0.5172 trillion. Execution days are counted from the original transaction detail, with intraday trades aggregated. The average does not substitute for actual daily execution or establish a certain daily reduction in absorption after completion.
For Korean-currency data, one hundred million won is KRW 100,000,000 and one trillion won equals 10,000 units of one hundred million won. One hundred million US dollars is USD 100,000,000. Korean jo and Chinese wanyi both denote a trillion; a trillion should not be mistranscribed as a hundred million. Tables identify currency and time. Futures transaction values are not added to cash-equity net purchases as a measure of cross-border outflows.
The residual across the three cited account categories is foreign net selling of KRW 2.7933 trillion minus individual net buying of KRW 1.6955 trillion and institutional net buying of KRW 0.8122 trillion, yielding KRW 0.2856 trillion. This is only an arithmetic balance of the reported categories. It is not assigned to a corporate buyback or a particular account; reconciliation of all investor categories requires the complete original classification table.
Let X denote the exchange-rate quote in won per US dollar. The dollar-denominated price return of an unhedged won equity equals the equity-price ratio multiplied by starting X divided by ending X, minus one, excluding dividends and taxes. The constant-leverage illustration assumes no subscriptions, redemptions, fees, dividends or other cash flows. Its rebalancing demand is ; an actual product additionally requires investor-flow and hedging treatment. Illustrative parameters are not presented as observed positions today.
Every chart plots discrete recorded observations or a clearly identified illustration. No minute-by-minute path is fabricated between news snapshots. Intraday prices do not constitute a complete closing-data file. Dynamic public queries should retain the range and date read for this edition to support subsequent verification and correction.
Sources and measurement records
- 자기주식취득결과보고서
2026-10-12
- SK hynix 자기주식매매 체결내역(유가증권시장), 2026-10-12
2026-10-12
- 코스피 6000선 붕괴···외국인 8월 이후 45조원어치 던졌다
2026-10-13 12:29 KST
- 코스피, 6300선까지 밀려...삼성전자 4%대 급락
2026-10-12 15:43 KST
- 외국인 매도 확대에…코스피 6000선 무너져
2026-10-13 10:32 KST
- 삼전닉스 4% 털썩…파랗게 질린 코스피 6400 무너졌다
2026-10-12 15:31 KST
- 주요사항보고서(자기주식취득결정)
2026-08-21
- 주요사항보고서(자기주식취득결정)
2026-08-19
- SK hynix 40 trillion won repurchase and cancellation plan
2026-08-19
- 자기주식매매 신청내역(유가증권시장)
2026-10-12
- Cont, Kukanov and Stoikov: The Price Impact of Order Book Events
2010预印本,2014期刊论文
- 코스피 3.7% 급락…반등 활로 찾을까
2026-10-13 06:25 KST
- 2026년 8월 이후 국제금융·외환시장 동향
2026-09-17 12:00 KST (Internet/broadcast embargo) / September18 print edition
- 2026년 8월 외국인 증권투자 동향
2026-09-18 (source page states release on Friday September 18)
- KRX KOSPI calculation and market introduction
读取2026-10-13,仅引用指数计算说明
- CXMT Announces Mass Production of 5th-Generation DRAM Technology Platform
2026-09-20
- 长鑫科技4F²研发进展与年底DDR5 RDIMM计划(上海证券报报道)
2026-10-10
- CXMT Debuts Latest DDR5 & LPDDR5X Portfolio
2025-11-23
- Samsung 3Q 2026 Pre-Earnings Guidance
2026-10-08
- SK hynix Announces 2Q26 Financial Results
2026-07-29
- AASB 133 每股收益示例2:已发行、库存和在外股数
准则示例,读取2026-10-13
- Microsoft FY2026 Q4 Earnings Conference Call
2026-07-29
- Meta Reports Second Quarter 2026 Results
2026-07-29
- Nasdaq SOX official historical API
2026-10-12
- Updated Investor Bulletin: Leveraged and Inverse ETFs
2023-08-29
- BIS Quarterly Review September 2026 Box B: Short on memory? Leveraged ETFs and chip stock volatility
2026-09-14
- Are Concerns About Leveraged ETFs Overblown?
2014-12
- KRX 程序交易Sidecar规则
读取2026-10-13
- KRX Circuit Breakers
读取2026-10-13
- Newsworks · Korean equity-market observation at 13:15 KST
2026-10-13 13:32 KST; market observation 13:15 KST
- SK hynix · Solidigm capital structure clarification
2026-10-01
- YTN · Korean equity closes and the 15:30 USD/KRW reference price
2026-10-13 15:39 KST; regular-session close and FX reference at 15:30 KST
- MoneyToday · Closing market report and investor net-trading estimates
2026-10-13 16:08:19 KST; updated 16:08:25 KST
- Seoul Shinmun · Closing report with alternative provisional net-trading figures
2026-10-13 15:35 KST; updated 15:59 KST
Research use and editorial responsibility
This report is published by Unique Aurora as market research. AI assisted source discovery, numerical checks and drafting. The analysis, interpretations and publication remain under the firm’s editorial direction. It is not investment advice or a recommendation to trade.
For a correction or replication question, identify the report ID, version, source or calculation concerned. ir@uniqueaurora.org