01 / Data and observation conventions
S01-S07 follow device-clock labels 2:00, 2:05, 2:07, 2:16, 2:19, 2:39 and 3:50. Device time and chart axes have not been reconciled to a common timezone. The IDs are neither equally spaced samples nor exchange-event sequences. A01 is a separate 15-minute overview used for the broader price path.
On a small screen, scroll the table horizontally. Keyboard: focus the table and use the arrow keys.
| ID / clock | Last / mark | Bid / ask |
|---|---|---|
| S01 / 2:00 | 266.99 / 267.20 | 267.15 / 267.18 |
| S02 / 2:05 | 269.66 / 269.78 | 269.66 / 269.69 |
| S03 / 2:07 | 268.38 / 267.89 | 268.33 / 268.35 |
| S04 / 2:16 | 271.72 / 271.96 | 271.61 / 271.66 |
| S05 / 2:19 | 269.04 / 269.39 | 269.01 / 269.09 |
| S06 / 2:39 | 285.31 / 286.06 | 285.30 / 285.37 |
| S07 / 3:50 | 268.83 / 268.66 | 268.81 / 268.84 |
The last price is transcribed from the page header; bid and ask are the first displayed order-book row. Components may refresh independently, so one image does not establish one exchange timestamp. In S01, the displayed last price of 266.99 is below the displayed bid of 267.15; this is not evidence of a tradable crossed market.
A 0.01 display selector is visible, but the exchange tick size is not inferred from it. Quantities are recorded as QNT under the interface base-asset convention, without an API or contract-specification reconciliation. The first-level quantities in S07 are cropped and remain missing, not zero.
These are selected interface observations, not comprehensive market data. Limited on-page transcriptions, formulas and source IDs permit arithmetic checks; a downloadable dataset and the original images are not distributed. Reproducible calculations do not independently authenticate the images or their refresh times.
02 / Price path and volatility regime
The 15-minute overview shows a rapid move to a labelled high of 374.50 followed by a retreat and trading at lower levels. Its rolling 24-hour low is 157.25. The exact timing and ordering of these extrema have not been reconciled to trades, so they are not combined into a single tradable return.
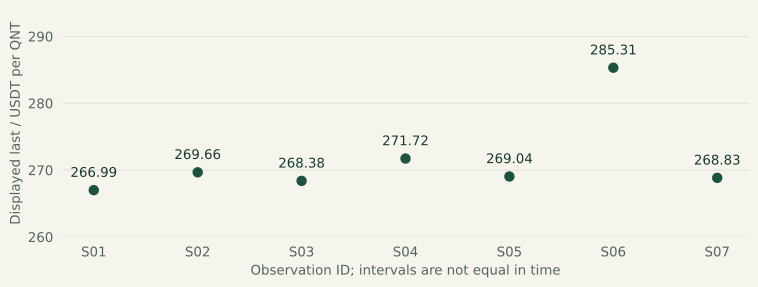
Figure 1 retains seven discrete last-price observations without interpolating a continuous path. S06 shows 285.31 and S07 subsequently shows 268.83, a difference of -5.78%. This compares selected displayed values, not a complete holding-period return distribution.
The five-minute chart in S07 labels a local high of 292.22; its displayed last price is approximately 8.00% lower. A move into a higher region was followed by a substantial retracement. The chart alone does not identify information repricing, inventory adjustment or leveraged liquidation as the mechanism.
There is consequently no statistical basis here for assigning a permanent support or resistance role to a round-price region such as 270. Time spent in the region, volume distribution, retests and depth changes would be more useful tests. These are not fully observed; realised volatility is not estimated.
03 / Quoted spread and visible depth
Let b and a denote the displayed best bid and ask. The quote midpoint is m=(a+b)/2, the spread s=a-b, and the relative spread 10,000s/m basis points. The denominator uses the quote panel, avoiding the potentially asynchronous last-trade display.
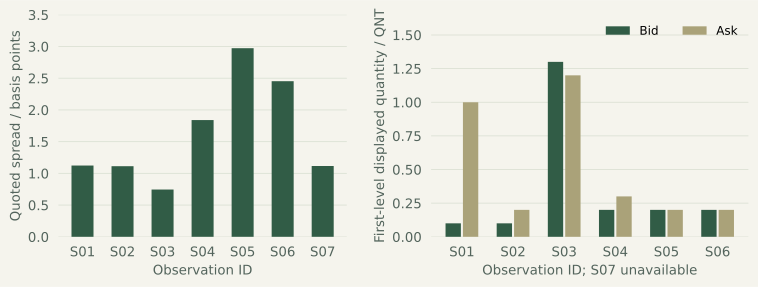
The seven relative spreads are approximately 1.12, 1.11, 0.75, 1.84, 2.97, 2.45 and 1.12 basis points. The largest is about four times the smallest. The median is not time weighted; unknown sampling and duration prevent inference about average liquidity over the window.
Readable best-bid quantities range from 0.1 to 1.3 QNT and best-ask quantities from 0.2 to 1.2 QNT. Against a 1 QNT immediate-order benchmark, four asks and five bids lack sufficient displayed quantity at the first level. This is a capacity comparison, not an execution simulation; deeper prices, hidden liquidity, cancellations and replenishment are unobserved.
The evidence supports the cross-sectional distinction between narrow spread and sufficient quantity. It does not establish persistent liquidity abundance or depletion. Execution cost also depends on direction, size, the depth curve, time and fees.
04 / Quote imbalance and order flow
For displayed first-level quantities q_b and q_a, define static imbalance I=(q_b-q_a)/(q_b+q_a). It lies between -1 and 1 and describes the side with more displayed quantity. S01 is -81.82%, S03 +4.00%, and S05 and S06 zero. These are not probabilities of an upward or downward move.
On a small screen, scroll the table horizontally. Keyboard: focus the table and use the arrow keys.
| Observation | Bid / ask quantity (QNT) | Top-level I |
|---|---|---|
| S01 | 0.1 / 1.0 | -81.82% |
| S02 | 0.1 / 0.2 | -33.33% |
| S03 | 1.3 / 1.2 | +4.00% |
| S04 | 0.2 / 0.3 | -20.00% |
| S05 | 0.2 / 0.2 | +0.00% |
| S06 | 0.2 / 0.2 | +0.00% |
S06 combines a last price of 285.31 with zero first-level imbalance. Price level and contemporaneous first-level quantity do not have a simple one-to-one interpretation. This is not a test against predictability: continuous observations, forward-return labels and out-of-sample validation are absent.
The interface also shows a buy/sell percentage bar, including 13.98% versus 86.02% in S07. Its depth range, aggregation and refresh rules are unverified. It is not interchangeable with I and cannot be read as net capital flow, investor counts or net short positioning.
Order-flow imbalance requires changes in quotes and quantities across events, including the effects of limit orders, trades and cancellations at the best quotes. Cont, Kukanov and Stoikov study its relation to short-term price changes in US equities.[4] That work motivates a method; it does not establish coefficients or predictive performance for QNTUSDT.
05 / Last price, mark price and derivatives state
The last-trade price records execution, while the mark price serves contract valuation and risk control. Binance states that liquidation assessment uses mark price rather than last-trade price alone.[2] They are distinct measurements and not instantaneous substitutes.
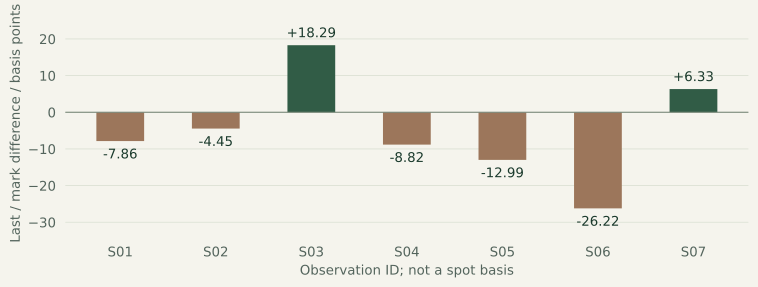
Define the displayed difference d=10,000(P_last/P_mark-1). It ranges from -26.22 to +18.29 basis points in the seven images. S06 shows a last price of 285.31 and mark of 286.06, approximately -26.22 basis points. Asynchronous component updates may contribute to the difference; it is not wholly interpretable as a tradable spread.
Figure 3 measures last-to-mark display differences, not perpetual-to-spot basis. There is no synchronised spot index, funding-rate, open-interest or liquidation stream in the sample. Arbitrage return, leverage crowding and liquidation size cannot be measured.
Funding payments form part of the mechanism anchoring perpetual prices to the spot index.[1] A leverage-driven explanation requires the applicable funding schedule, realised rates and open-interest changes, alongside trades and liquidation records. A rising price alone cannot distinguish new long positions from short covering.
06 / Replication plan and conclusion
The on-page tables retain limited transcription inputs and derived values. Empty quantities mean unreadable, and clock labels are preserved without an invented UTC conversion. Spread, first-level imbalance and last-to-mark differences can be recomputed from the corresponding inputs. Observations are not interpolated or weighted as representative samples.
A full empirical study needs QNTUSDT depth snapshots and incremental updates, retaining sequence IDs, exchange time and receipt time. Continuity and gaps should follow the official reconstruction rules.[3] Aggregated-trade fields and grouping must also follow the API specification; a message is not assumed to be an independent order.[5]
Predefine event and comparison windows, then measure spread distributions, depth within fixed price bands, aggressive-flow imbalance, OFI, funding and open-interest changes on a common clock. Relationships with future midpoint moves belong in an independent validation sample. Execution studies additionally require order size, fees, latency and unfilled opportunities.
The images show large price adjustment coexisting with limited first-level quantity, and illustrate why last price and interface percentages are insufficient microstructure data. The report supplies reproducible quote observations and a defined validation path, without a directional forecast, causal attribution or executable-strategy conclusion.
Methods, limitations & editorial status
Data and editorial note: inputs were manually transcribed from images supplied by the website owner. S01-S07 are quotation views; A01 is a separate 15-minute overview. No live feed or full order book was obtained, the original images were not independently authenticated, and device clocks have not been aligned to a common timezone. Version 2.1 narrows the public edition to a data note; the earlier PDF has been withdrawn for full revision. AI assisted organisation, calculation and editing. This is not peer reviewed.
Scope: selected historical screenshots from one interface, not a representative market sample. The report supplies no current quote, investment recommendation, return forecast or trading signal. Metrics apply only to the stated observation convention.
Sources & further reading
Observation inputs are the owner-supplied interface images described in the data section. Original images are not publicly available at present. The references below explain market-data methods and contract mechanics; they do not independently verify this screenshot sample.
- Binance. Introduction to Binance Futures Funding Rates.
- Binance. Futures Liquidation Protocols.
- Binance Developer Docs. How to manage a local order book correctly.
- Cont, R., Kukanov, A. & Stoikov, S. (2014). The Price Impact of Order Book Events. Journal of Financial Econometrics, 12(1), 47-88.
- Binance Developer Docs. USDⓈ-M Futures REST API: Market Data / Compressed-Aggregate Trades.