Research summary
The new earnings releases show three different stages of the AI investment cycle. Amazon combines faster cloud growth and stronger operating profit with a large cash shortfall after infrastructure investment. Intel’s current-quarter recovery coexists with a weaker next-quarter outlook. Sandisk reports strong profit and cash generation, but its joint-venture funding and customer-payment adjustments require a wider view than cash property purchases alone. Operating performance, the expectations gap and funding structures require separate assessment. [1] [3] [5]
The central question is where cash is being generated, where it is being committed, and which future assumptions connect the two. Demand growth can benefit an upstream supplier before a platform buyer has recovered its investment. That timing difference can persist, while technological competition and capacity expansion can change who captures the return. The report examines disclosed company-wide results; it does not allocate undisclosed spending to individual AI projects.
Three distinctions govern the analysis: reported performance versus the market’s prior expectations; quarterly cash flows versus rolling totals; and internally funded capital spending versus spending supported by partners, public incentives or customer payments. The comparisons are designed to clarify these mechanisms, rather than rank businesses with different accounting boundaries.
Report periods and the information window
All three releases are dated 29 October 2026, but their reporting periods do not end on the same day. Amazon’s quarter ends on 30 September, Intel’s on 26 September and Sandisk’s on 2 October. Sandisk calls the period fiscal Q1 2027. Its sequential comparisons refer to fiscal Q4 2026, whereas the other companies use calendar Q3 and Q4. Each table retains its own period labels and USD-million units. [1] [3] [5]
The evidence window closes at 21:23 UTC on 29 October, equivalent to 17:23 EDT and 05:23 Beijing time on 30 October. Written releases and the available presentation provide the factual basis. Complete current-quarter call Q&A is outside this edition. A company’s projected growth, analyst consensus and actual results remain separate categories of information.
Reuters reports provide a contemporaneous reference for expectations and after-hours reactions. Those reactions are not 30 October closing returns or a synchronised cross-market price series. This edition does not estimate any company’s contribution to an index move. Its conclusions concern earnings, investment and the conditions required for cash recovery; news observations retain their dates and trading-session scope. [2] [4] Attributed news interviews also provide the explicitly identified factory-supply information.
Amazon: operating expansion and an expectations gap
Amazon’s revenue was USD 201.944 billion, up approximately 12.1% year on year. Operating income rose from USD 17.422 billion to USD 28.076 billion, giving a margin of approximately 13.9%. AWS revenue reached USD 45.984 billion, up approximately 39.3%, and operating income was USD 17.773 billion. These results describe expanding operations; the main concern cannot be reduced to a collapse in cloud demand. [1]
Net income nevertheless slipped from USD 21.187 billion to USD 20.685 billion. The company identifies USD 9.5 billion of pre-tax gains on Anthropic investments in the prior-year quarter as the principal comparison effect. Investment valuation gains and operating profit have different persistence. Amazon also says moving Prime Day largely into Q2 lowered the reported Q3 growth comparison by approximately four percentage points; that is a company estimate of a timing effect, not an independently observed alternative revenue figure. [1]
The fourth-quarter sales range is USD 240–247 billion, with a midpoint of USD 243.5 billion. Reuters cites an LSEG consensus of USD 244.51 billion: the midpoint is approximately 0.4% lower, while the consensus remains inside the company’s range. Operating-income guidance is USD 28.5–33.5 billion. The sales outlook deserves scrutiny, but the midpoint comparison alone cannot identify the cause or scale of the market repricing. Cash investment requires separate assessment. [1] [2]
Amazon: the quarterly bridge and the rolling deficit
Quarterly operating cash flow was USD 42.422 billion. Cash property and equipment purchases were USD 77.259 billion, offset by USD 1.381 billion of proceeds from asset sales and incentives. Applying the company’s free-cash-flow definition gives USD 42.422 billion minus USD 75.878 billion, or negative USD 33.456 billion. A year earlier the corresponding calculation was positive USD 1.297 billion. Operating cash increased, but the increase in investment was much larger. [1]
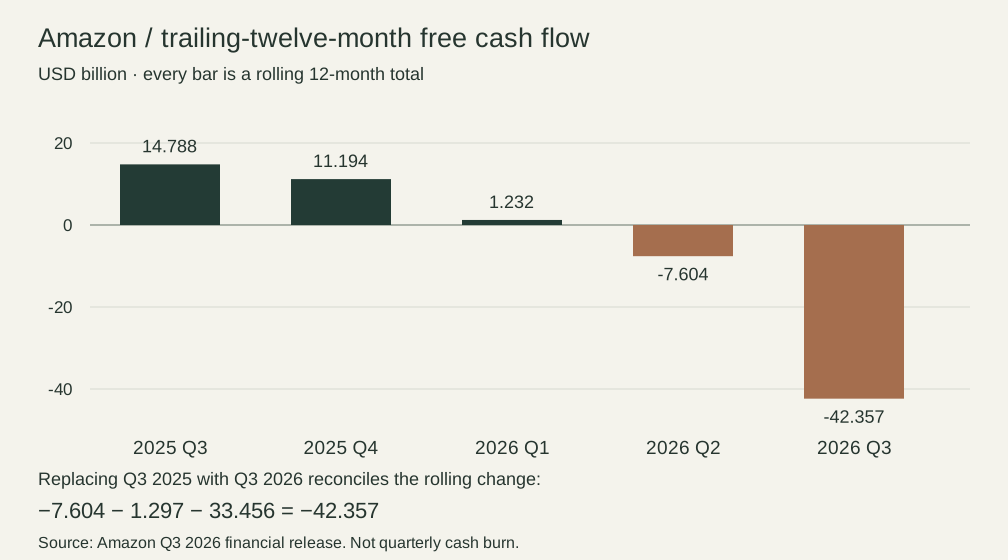
The widely reported negative USD 42.357 billion is the trailing-twelve-month total, not the quarter alone. The previous rolling total was negative USD 7.604 billion. Replacing the positive USD 1.297 billion from Q3 2025 with negative USD 33.456 billion from Q3 2026 reconciles the change exactly: −7.604 − 1.297 − 33.456 = −42.357. A rolling total changes when a new quarter enters and an old quarter leaves; its movement must not be described as the current quarter’s standalone cash burn. [1]
The calculation still has a defined boundary. Quarterly finance-lease principal of USD 433 million and financing-obligation principal of USD 107 million sit in financing activities; deducting both gives a supplementary balance of negative USD 33.996 billion. Non-cash leased equipment is not another current cash payment. Long-term debt proceeds of USD 48.102 billion help explain funding capacity, while the company maintained cash-capex guidance of roughly USD 220 billion for 2026. Financing supports construction but does not establish an economic return on that construction. [1]
| Measure | Q3 2026 | Q3 2025 |
|---|---|---|
| Operating cash flow | 42,422 | 35,525 |
| Cash property purchases | 77,259 | 35,095 |
| Sale proceeds and incentives | 1,381 | 867 |
| Net cash investment | 75,878 | 34,228 |
| Calculated quarterly FCF | -33,456 | 1,297 |
| TTM FCF (12 months) | -42,357 | 14,788 |
Figure 1 / Amazon’s rolling cash balance
Q3 2025–Q3 2026 reporting dates · USD billion; each bar covers twelve months
Intel: operating improvement and an outlook shortfall
Intel’s third quarter combines improving current operations with a weaker next-quarter outlook. Revenue was USD 16.513 billion, up 20.9%, and operating income was USD 2.522 billion, versus USD 683 million a year earlier. Data Center and AI revenue rose 77.8%, while client revenue fell 5.1%. The statements show divergence in demand and the ability to translate it into delivered capacity. Whether server demand becomes available supply deserves closer attention than consolidated growth alone. [3]
GAAP net income attributable to Intel was USD 3.320 billion, down 18.3%, and diluted EPS fell from USD 0.90 to USD 0.60; non-GAAP EPS increased from USD 0.23 to USD 0.52. Net income and EPS changed at different rates: alongside a larger share count, diluted EPS uses a specific adjustment for escrowed shares. Prior-year divestiture gains and current escrow-share fair-value movements affect comparability. Operating income, attributable net income and adjusted profit therefore need separate readings. [3]
The larger expectations gap concerns the fourth quarter. Revenue guidance of USD 15–16 billion has a midpoint of USD 15.5 billion, 6.1% below the latest quarter. The retrieved Reuters report cites LSEG consensus of USD 17.07 billion, placing the midpoint 9.2% below that reference; non-GAAP EPS guidance of USD 0.25 compares with consensus of USD 0.43. Consensus is a dated expectations snapshot, not a fixed benchmark. Reuters also quotes the CFO estimating a roughly USD 300 million fourth-quarter revenue impact from the Israel factory accident; that company-specific supply event should be distinguished from end-demand changes. Follow-up should distinguish PC demand, product mix and factory constraints in revenue and margin outcomes; a single after-hours quotation cannot establish an industry-wide operating change. [3] [4]
Intel: capital spending, partner funding and foundry measurement
Quarterly operating cash flow was USD 5.082 billion and disclosed gross capital expenditures were USD 4.219 billion, leaving USD 863 million. Deducting USD 119 million of finance-lease payments leaves USD 744 million. The company’s adjusted free cash flow of USD 1.639 billion additionally includes USD 48 million of capital-related government incentives and USD 847 million of net partner contributions. This bridge uses the quarterly supplemental table: the nine-month operating cash flow of USD 13.184 billion is not the quarter’s amount. [3]
These definitions affect an assessment of investment funding. Government incentives and partner funding reduce the current cash burden but have different economic sources from customer-generated operating receipts. A year earlier, operating cash flow less gross capital expenditures was negative USD 410 million, while company-adjusted free cash flow was positive USD 896 million. Both measures improved this year, but their reconciling items remain relevant. Public equity financing increases funding capacity and the share count; financing proceeds, operational improvement and returns on new assets require separate assessment. [3]
Foundry revenue of USD 6.697 billion includes internal transactions, while the group reports USD 6.291 billion of intersegment eliminations. Segment revenue cannot be treated as external customer sales or simply added to product revenue. The foundry operating loss narrowed from USD 2.321 billion to USD 1.853 billion, reducing the operating burden without establishing a mature external foundry model. External orders, utilisation, yields, product transitions and depreciation should be examined to distinguish internal manufacturing expansion from sustainable external returns. [3]
| Measure | Q3 2026 | Q3 2025 |
|---|---|---|
| Operating cash flow | 5,082 | 2,546 |
| Gross capital expenditure | 4,219 | 2,956 |
| CFO less gross capex | 863 | -410 |
| Finance-lease payments | 119 | 94 |
| Capital government incentives | 48 | 54 |
| Net partner contributions | 847 | 1,346 |
| Company-adjusted FCF | 1,639 | 896 |
Sandisk: volume, pricing and diverging end markets
Sandisk’s first quarter of fiscal 2027 ended on 2 October. Revenue was USD 11.031 billion, up 23% sequentially and 378% year on year; GAAP gross margin was 85.0% and adjusted gross margin 85.1%. Datacenter revenue of USD 4.802 billion rose 61% sequentially and increased by USD 1.825 billion, approximately 88.3% of the USD 2.066 billion total net revenue increase. Edge revenue of USD 5.832 billion rose 7%, while Consumer revenue of USD 397 million fell 29%. Enterprise storage expansion and consumer pressure can therefore coexist; consolidated growth does not establish a simultaneous recovery across every end market. [5]
The presentation attributes approximately 60% of the sequential revenue increase to volume and 40% to pricing. These are contributions to incremental revenue, not a 60% increase in volume or a 40% rise in average selling prices. The company also reports allocating more supply to Datacenter while Consumer markets adjust to higher prices. Deliveries, pricing and supply allocation therefore interact. A greater Datacenter revenue share does not independently establish lower demand elasticity across all products, and the pricing environment cannot be extrapolated unconditionally to other end markets. [6]
Next-quarter revenue guidance of USD 12.2–12.6 billion has a midpoint approximately 12.4% above the latest quarter. Adjusted gross-margin guidance of 84.5–85.5% has a midpoint close to the current level. Management therefore expects further revenue expansion while margins broadly hold their elevated level; that revenue still requires actual delivery. Margin persistence depends on supply, demand, product mix and costs. The guidance supports a next-quarter operating expectation, not proof that longer-term scarcity or returns are already secured. [5]
Sandisk: cash generation after joint-venture investment and prepayments
In USD millions, Sandisk reported operating cash flow of 6,363 and direct property, plant and equipment purchases of 54, producing its disclosed free cash flow of 6,309. Including net cash outflows of 148 related to Flash Ventures and removing the 465 effect of NBM prepayments and deposits produces company-adjusted free cash flow of 5,696. The bridge preserves cash generation, joint-venture manufacturing investment and the timing of customer funding separately. Prepayments provide cash alongside future performance obligations; they are not operating returns on products already delivered. [5]
The USD 54 million does not cover all Sandisk capital investment. The presentation reports a 324 share of joint-venture gross capex; external funding of 44 and tool depreciation funded through wafer purchases of 132 reduce this to joint-venture cash capex of 148. Adding direct property and equipment purchases of 54 produces total cash capex of 202, or 1.8% of revenue. Total gross capex is 378, or 3.4%. These differences reflect manufacturing and financing arrangements. Comparing investment intensity across companies requires examining who provides funding and how costs enter wafer purchases. [6] Tool-depreciation funding flows through wafer purchases; it is not an additional direct PPE payment to deduct again from operating cash flow.
Operating cash flow declined from 7,126 in the previous quarter to 6,363, while adjusted free cash flow rose from 5,035 to 5,696. The opposing directions should be read alongside the reduction in the NBM funding adjustment from 1,938 to 465. Changes in receivables and inventory also absorbed 1,877 and 318 of cash during the quarter, showing that rapid revenue growth still requires collections and working-capital support. High gross margins leave room to absorb cost changes, while cash recovery still depends on collections and investment. Follow-up should examine collections after delivery, joint-venture investment and contract execution while preserving the different questions answered by reported cash flow and the adjusted measure. [5]
| Measure | Q1 FY27 | Q4 FY26 |
|---|---|---|
| Operating cash flow | 6,363 | 7,126 |
| Direct cash PPE purchases | 54 | 43 |
| Company FCF | 6,309 | 7,083 |
| Net Flash Ventures outflow | 148 | 110 |
| NBM payment adjustment | 465 | 1,938 |
| Company-adjusted FCF | 5,696 | 5,035 |
Where the investment cycle divides
A platform expanding data-centre capacity, a processor and foundry business, and a NAND supplier occupy different positions in the same broad investment cycle. Procurement can support a supplier’s current revenue while the purchaser awaits future service receipts. That is a timing and bargaining-power hypothesis consistent with these disclosures, not evidence that a particular Amazon expenditure became a particular Sandisk sale. Customer links and AI-project allocations require separate disclosure. [1] [3] [6]
The financing structures also differ. Amazon’s free-cash-flow measure nets asset-sale proceeds and incentives against purchases. Intel’s adjusted measure adds public incentives and partner contributions after deducting finance leases. Sandisk’s adjusted measure includes net Flash Ventures funding and removes specified customer-payment effects. Presenting all three as an identical free-cash-flow margin would hide who funds the assets and when the cash is received. Each bridge must be understood before comparing its sign. [1] [3] [5]
Nor does one quarter identify a permanent winner. Sandisk’s pricing and product mix can change when supply expands or customers adjust consumption. Amazon’s cash investment can earn a return if capacity is absorbed at adequate prices. Intel’s recovery depends on demand, delivery and capital discipline as well as manufacturing execution. The useful comparison is the evidence needed to sustain each explanation over several quarters.
On narrow screens, scroll the table horizontally. Keyboard users can focus it and use the arrow keys.
| Company | Current evidence | Principal uncertainty | Follow-up evidence |
|---|---|---|---|
| Amazon | Cloud and operating profit expand | Investment recovery period | Cash investment and incremental collections |
| Intel | Current earnings improve; outlook weakens | Demand and delivery constraints | Q4 delivery, margins and funding mix |
| Sandisk | High margins and positive adjusted cash flow | Pricing durability and cash timing | Collections, JV funding and contract execution |
Expectations, valuation and the cost of waiting
A weak share reaction can follow improving current results when expectations for the next period fall. Conversely, a sharp increase in earnings can coexist with greater sensitivity to a cyclical peak. The relevant valuation object is the future cash-flow path and its uncertainty, not a mechanical ranking by the latest growth rate. This report uses dated consensus only to establish the scale of a specific expectations gap; it does not infer the market’s entire valuation model from it.
Capital-intensive growth creates a waiting period between the initial payment and the ultimate return. Profitable operations may coexist with a financing requirement during that interval. The test is whether cumulative incremental cash receipts ultimately cover investment, replacement and the cost of capital. Neither a quarterly cash shortfall nor a positive adjusted balance resolves that lifetime-return question on its own.
No target prices are provided because this edition does not establish consistent forecasts for capacity, customer consumption, maintenance investment, lease payments and discount rates. It instead identifies what would change the assessment: slower investment without weaker service demand, durable processor margins despite a softer outlook, or storage cash generation that remains strong after joint-venture funding and customer-payment adjustments.
Conditions to test in the next review
For Amazon, track cash capex, quarterly and rolling cash balances, AWS consumption and operating margins together. The advance-build explanation gains support if new capacity earns incremental receipts while investment intensity moderates. It weakens if maintaining comparable service growth requires repeated expenditure increases or if debt funding expands without improving cash recovery. Working-capital seasonality must be retained when interpreting individual quarters.
For Intel, compare subsequent results with its own Q4 guidance and the delivery assumptions behind it. Distinguish processor demand from foundry economics, and partner funding from cash generated by operations. For Sandisk, test whether data-centre growth and pricing hold alongside cash collection, inventories, joint-venture funding and contractual obligations. Higher recognised revenue without similar collections would warrant closer examination even if accounting margins remained high.
The first market follow-up should use regular-session prices and a common observation window. The operating hypotheses require later quarterly results and cannot be resolved by a few days of share performance. Subsequent editions should preserve the original assessment, identify new evidence and explain any revision, so that a change in interpretation remains visible rather than replacing the earlier record.
Sources and observation records
Quarterly figures are unaudited. The edition uses written earnings releases and presentations available by the information cutoff, not complete earnings-call Q&A. News consensus estimates are dated reference points; after-hours observations are not regular-session closing returns. Attributed news interviews supplement the identified supply event.
- Amazon · Q3 2026 results, Exhibit 99.1
Regulatory filing · 2026-10-29
- Reuters via WIKY · Amazon slides on light fourth-quarter sales estimates, cash burn
News report · 2026-10-29
- Intel · Third-quarter 2026 financial results
Company disclosure · 2026-10-29
- Reuters syndicated · Intel shares drop 14% on Israel factory blast, PC weakness
News report · 2026-10-29
- Sandisk · Fiscal first-quarter 2027 financial results
Company disclosure · 2026-10-29
- Sandisk · Fiscal Q1 2027 financial-results presentation
Company disclosure · 2026-10-29
Research use and editorial responsibility
This report is published by Unique Aurora as market research. AI assisted source discovery, numerical checks and drafting. The analysis, interpretations and publication remain under the firm’s editorial direction. It is not investment advice or a recommendation to trade.
For a correction or replication question, identify the report ID, version and the passage or calculation concerned. info@uniqueaurora.org