Research summary
Whether AI demand grows and whether that growth converts into cash at an acceptable capital cost are separate questions. This report compares Alphabet and Microsoft using financial statements for the same calendar quarter and a common cash definition. Both spent more than 40% of revenue on cash property and equipment additions. Alphabet's operating cash flow did not cover those additions; Microsoft retained a surplus, but a smaller one than a year earlier. Ranking the companies by revenue growth or the sign of this surplus alone would miss important differences in capital consumption and cash conversion. [1] [2]
The analysis considers revenue, operating cash flow, capital additions, leases and future depreciation together. It examines investment speed, cash recovery and economic returns over asset lives. A quarterly cash shortfall can reflect valuable advance construction or the early stages of weaker returns. Financial statements alone cannot settle that distinction without subsequent evidence on utilisation, pricing and customer retention.
The policy and earnings events on 28 October provide the context, but this report does not treat a company's after-hours decline as an identified cause of a broad-market retreat. It distinguishes disclosed financial facts, reproducible calculations and transmission hypotheses that require additional market data. The purpose is to translate a short-term price response into operating and valuation questions that can be followed over time.
Event sequence and observation limits
The Federal Reserve released its decision at 14:00 EDT on 28 October. Alphabet and Microsoft listed earnings calls scheduled for 16:30 and 17:30 EDT, respectively. These correspond to 02:00, 04:30 and 05:30 on 29 October in Beijing. A scheduled call time is neither the first dissemination time of an earnings release nor proof that investors learned all relevant information at that minute. Dates and time zones must be aligned before prices, trading activity and news are compared. [5] [1] [2]
Reuters reported an after-hours decline of more than 10% in Alphabet shares. This is a news observation with a specific trading-session scope, not the next regular-session closing return. This report neither reconstructs a minute-by-minute price path from it nor estimates Alphabet's contribution to an index decline. After-hours quotations, regular closes and cross-asset moves cannot be combined without a common reference point. [6]
The policy statement, financial tables, call commentary and other macroeconomic news can change expectations in sequence. A stronger claim that one company caused a market decline requires first-publication timestamps, aligned index and constituent prices, volume and rate changes, and consideration of overlapping events. Mechanical index-weight contributions must also be separated from repricing in other firms: the former is return attribution, while the latter concerns information transmission.
| Event | EDT | Status |
|---|---|---|
| FOMC statement | 14:00 | Official release |
| Alphabet call | 16:30 | Scheduled |
| Microsoft call | 17:30 | Scheduled |
Profit, investment gains and capital spending
Alphabet's operating income rose approximately 30% year on year, while net income attributable to common stockholders fell approximately 25%. Disclosed net losses on equity securities, including realised and unrealised gains and losses, are an important part of the explanation for the net-income change. It would therefore be incorrect to attribute the whole decline to AI operations or to equate an increase in cash capital spending with an equal reduction in current profit. Operating income, non-operating investment results and the cash-flow statement answer different questions. [1]
Capitalised equipment and building expenditures generally create assets first and affect later profits through depreciation; cash can leave well before the full depreciation charge appears. A longer estimated useful life can improve current reported earnings without reversing cash already paid. Conversely, quarterly cash pressure does not by itself establish impairment of newly acquired assets. Useful lives, replacement cycles and residual-value assumptions need scrutiny alongside reported margins.
This report calls operating cash flow less cash additions to property and equipment the 'post-capex cash balance'. The explicit definition keeps lease financing, acquisitions, securities investments and distributions from being conflated. It is not the entire amount distributable to shareholders and is not a return-on-capital measure. Operating cash flow also reflects working-capital timing and adjustments for non-cash items; sustainable earning power requires consideration of stock-based dilution, taxes and maintenance investment. Alphabet defines the same calculation as free cash flow; this report retains the common label for comparison and does not treat it as either company’s AI-project cash flow. [1]
Cash conversion in the same quarter
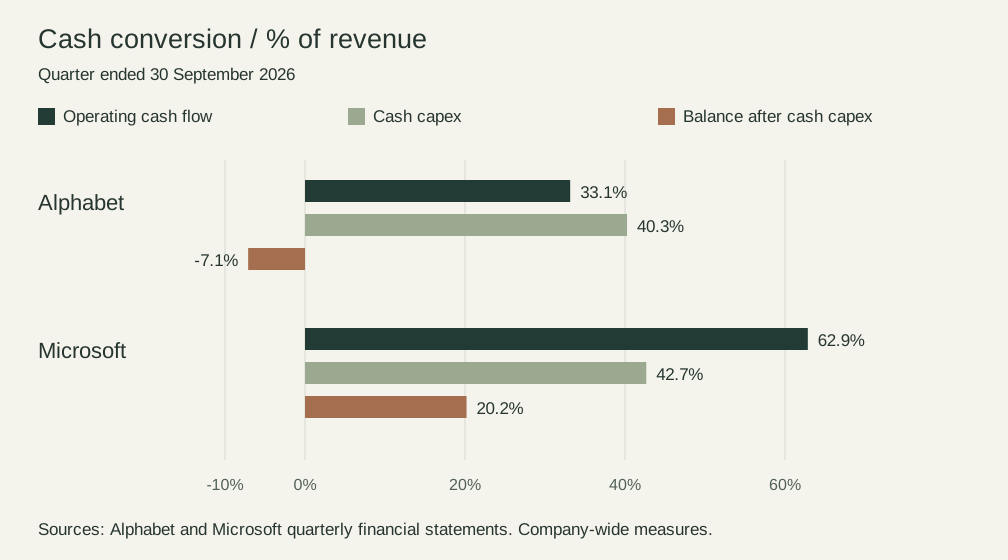
The fiscal labels differ—Alphabet's third quarter of 2026 and Microsoft's first quarter of fiscal 2027—but both periods end on 30 September 2026. The table uses USD millions and the cash-flow-statement definition of cash property and equipment additions. Revenue-normalised ratios reduce the influence of company size. Ratios are calculated from the original amounts and rounded only afterwards, rather than calculated from rounded billions. [1] [2]
The comparison shows similar cash investment intensity, with the difference in cash balances primarily reflecting operating cash flow relative to revenue. This is not an AI-specific margin comparison: the consolidated statements contain different businesses, billing cycles and collection arrangements. Microsoft's higher quarterly cash conversion may include enterprise subscription collections and working-capital timing, and should not be extrapolated mechanically to every quarter. Microsoft reports a USD 17.104 billion operating cash inflow from changes in accounts receivable and a USD 5.942 billion outflow from unearned revenue. At Alphabet, changes in receivables, inventory and other assets reduced operating cash flow by USD 3.917 billion, USD 3.220 billion and USD 7.807 billion, respectively. Collections and asset commitments therefore matter to quarterly cash performance; these movements cannot all be assigned to AI or explain the entire difference between the companies on their own. [1] [2]
Persistence is the key question. If newly installed capacity generates incremental cash while the pace of spending moderates, current pressure can ease. If each increment of revenue instead requires progressively more equipment and lease commitments, expansion can coincide with lower economic returns. Follow-up work should compare cumulative investment and recovery rather than select a favourable quarter.
| Measure | Alphabet | Microsoft |
|---|---|---|
| Revenue | 127,577 | 92,279 |
| Operating cash flow | 42,290 | 58,000 |
| Cash property & equipment additions | 51,355 | 39,367 |
| Post-capex cash balance | -9,065 | 18,633 |
| Operating cash flow / revenue | 33.1% | 62.9% |
| Cash capex / revenue | 40.3% | 42.7% |
| Balance / revenue | -7.1% | 20.2% |
Figure 1 / Cash generation and investment intensity
Quarter ended 30 September 2026 · Percent of consolidated revenue
Alphabet: quarterly pressure and a rolling view
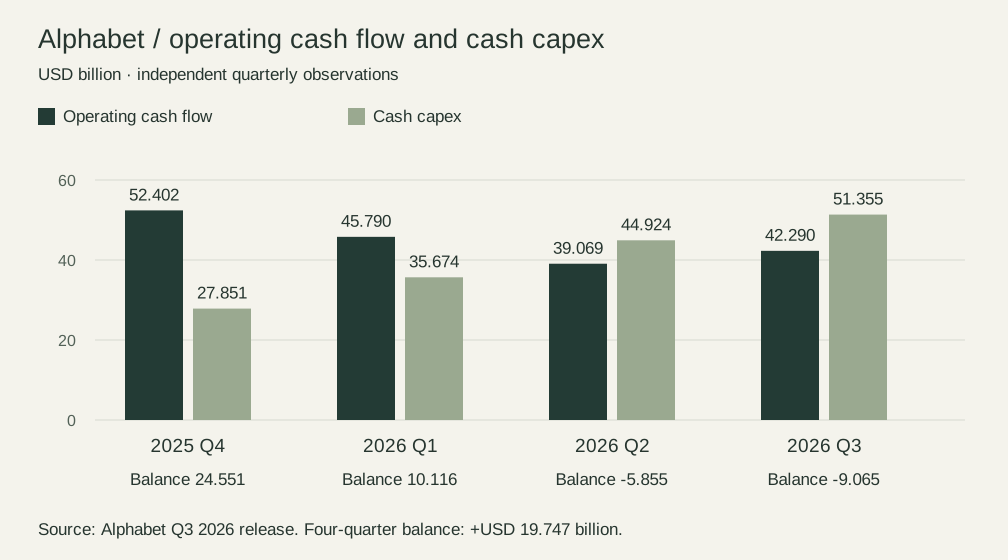
Alphabet's post-capex cash balance moved from positive to negative over the latest four quarters. The most recent two quarters were negative USD 5.855 billion and negative USD 9.065 billion; the four-quarter total remained positive USD 19.747 billion. Both observations matter: quarterly pressure has intensified, but this alone does not establish an inability to finance investment or an immediate liquidity crisis. The figure shows the cash inflow and capital spending that generate the balance, rather than substituting net income for cash flow. [1]
A rolling four-quarter measure smooths seasonality but can remain supported by an earlier strong quarter. A positive rolling balance does not erase deterioration at the margin; mechanically annualising the latest quarter can also misread concentrated equipment deliveries, tax payments or collection timing as a steady state. Quarterly, year-on-year and rolling measures should therefore be retained together and their signals compared.
The question for Alphabet is whether additional capacity produces identifiable cash returns through cloud services, advertising products or other businesses within a reasonable period. Larger expenditure must be distinguished from falling efficiency per unit invested. Advance capacity deployment creates a lag between spending and revenue, but describing spending as long term is not evidence of a return. Supporting evidence would include utilisation, conversion of contracted demand, customer mix and improving cash conversion.
Funding also distinguishes cash pressure from exhausted resources. Alphabet reported quarterly net proceeds of USD 12.371 billion from common-stock issuance and USD 28.996 billion from debt issuance; cash, cash equivalents and marketable securities totalled USD 265.098 billion at September end. These resources increase spending capacity, but investors still bear dilution, debt service and the opportunity cost of capital. Access to financing cannot substitute for testing investment returns. [1]
Figure 2 / Alphabet: four quarters of cash investment
2025 Q4–2026 Q3 · USD billion; discrete quarterly observations
Microsoft: a positive balance and the lease boundary
Microsoft's post-capex cash balance was USD 18.633 billion, compared with USD 25.663 billion a year earlier, a decline of approximately 27.4%. A positive balance and rising capital pressure can coexist. Highlighting only the positive amount misses the fact that incremental operating cash flow did not fully offset additional cash capital spending; focusing only on spending misses the cash buffer provided by existing operations. [2]
Cash property and equipment purchases do not capture every way capacity is obtained. Microsoft's 10-Q reports USD 1 billion of cash principal repayments on finance leases during the quarter; subtracting this produces a balance of USD 17.633 billion. This is a deliberately limited supplementary measure. Finance-lease interest is already included in operating cash flow and must not be deducted again here. Right-of-use assets obtained through finance leases are non-cash additions and must not be described as current cash spending. [3]
The company also discloses USD 364.6 billion of leases that have not yet commenced, expected to begin between fiscal 2027 and 2034. Some arrangements remain subject to contractual conditions. These are important capacity commitments and contractual constraints, not current-quarter cash outflows or an amount to add unadjusted to recognised debt. Commencement dates, terms, uses and payment profiles determine how they become future cash burdens. The current surplus should not obscure these obligations across periods. [3]
Accounting classification can also change. In its previous earnings call on 29 July, Microsoft explained an extension of estimated useful lives for datacentre and office buildings from fiscal 2027 and described implications for future lease classification. This is historical accounting guidance, not a new October forecast. Comparisons of capital spending across periods should examine shifts from finance-lease to operating-lease treatment, so that classification changes are not mistaken for lower physical capacity demand. [4]
| Measure | Amount | Treatment |
|---|---|---|
| Post-capex balance | 18,633 | Starting balance |
| Finance-lease principal | 1,000 | Deduct once |
| Balance after principal | 17,633 | Supplementary |
| Finance-lease interest | 769 | Already in CFO |
| New finance-lease ROU assets | 5,192 | Non-cash |
| Uncommenced leases | 364,600 | Future commitments |
Cloud growth and AI economics
Google Cloud reported quarterly revenue of USD 30.709 billion, up approximately 103%, and operating income of USD 11.121 billion, an operating margin of approximately 36.2% calculated from disclosed amounts. Microsoft reported Azure revenue growth of 48% and Microsoft Cloud revenue of USD 63.9 billion, up 30%. These figures support continued cloud-demand expansion, but Google Cloud, Azure and Microsoft Cloud cover different businesses and their growth rates are not a like-for-like product comparison. Alphabet also identified TPU systems sales as a meaningful growth contributor; system deliveries and recurring consumption services can have different revenue and collection patterns. [1] [2]
Each step from demand to return needs testing: contracted demand is not current revenue, revenue is not current collection, and collected cash is not profit after the full cost of capital. Backlog and commitments can improve visibility, but delivery depends on capacity, customer execution and contract terms. If scarcity raises prices while inducing extensive industry expansion, current growth and medium-term returns can still move in different directions. Microsoft’s commercial remaining performance obligation was USD 677 billion, up 73%; this record of future revenue is neither current cash collected nor a return after fulfilment costs. [2]
AI infrastructure contains heterogeneous assets. Land, power connections, buildings and servers have different lives and replacement risks. Buildings may remain useful for many years, while computing equipment faces performance substitution and price declines. Treating all investment as one asset with one lifetime can understate replacement expenditure or overstate competitive durability. Customer switching costs, software and data integration, power access and inference costs are more informative than capital scale alone.
FOMC: the policy level and changes in expectations
On 28 October, the FOMC maintained the federal funds target range at 3.75–4.00%, with two dissenters preferring a 25-basis-point increase. This identifies the policy level and disagreement within the committee, but an unchanged rate is not the same as an absence of new information. If a hold was already expected, wording, dissent or the perceived future path may matter more for prices. Without pre-decision expectations data, the size of the policy surprise cannot be measured. [5] The statement also described strong economic expansion, robust capital investment and still-elevated inflation. This supports retaining the opportunity cost of capital as an analytical condition; it does not establish that policy caused any particular post-earnings price decline. [5]
Rates affect capital-intensive growth through at least two channels. One is discounting: later cash returns are generally more sensitive in present-value terms to a change in discount rates. The other is financing and capital allocation: projects have an opportunity cost even when funded internally. A large cash balance does not make capital free or remove shareholders' requirements concerning timing and uncertainty.
The policy rate, Treasury yields and equity discount rates are not interchangeable. The yield curve incorporates term and inflation expectations, while equity valuations also reflect risk premia and company-specific risk. When shares and long yields move around an earnings release, a fixed rate sensitivity cannot explain the entire return. Analysis must examine whether yields moved before the release, whether peers repriced together and whether cash-flow forecasts changed.
Valuation: the cash support required by growth
One testable interpretation of repricing is that revenue growth may not compensate for greater investment intensity and a longer wait for returns. This is not a claim about the model the market has actually adopted; it identifies variables to examine. Even a company with rising revenue and operating profit can command a lower valuation multiple if new capital is recovered more slowly or with greater risk.
A valuation should distinguish investment needed to maintain the existing business from expansion investment, but consolidated public statements rarely permit an exact separation. Treating all expenditure as permanent maintenance can undervalue a construction phase; treating all of it as cancellable growth spending can overstate free cash flow. Multiple maintenance and utilisation paths, with explicit assumptions, provide a more defensible approach.
This report does not provide a target price because it does not construct a consistent annual forecast for business cash flows, asset replacement, lease payments and capital costs. A precise price without those inputs would imply more certainty than the evidence supports. The narrower conclusion is actionable for research: track post-capex cash alongside growth, include leases in obligations across periods, and do not substitute improving profit for evidence of cash recovery.
Three scenarios and evidence that would challenge them
The first scenario is the gradual monetisation of advance construction. If capacity utilisation rises, cash conversion holds or improves and cash capital spending falls relative to revenue, present pressure may be transitional. Evidence against it would include repeated spending increases needed to sustain the same incremental revenue, or customer usage and contract conversion falling materially short of construction plans. Management confidence in long-term demand alone cannot establish this scenario.
The second scenario is a capital burden that remains higher than expected. Equipment replacement, lease commencements and competitive pricing could prevent revenue growth from improving cash returns. Relevant measures include multi-quarter cash balances, depreciation, lease principal and interest, business margins and funding sources. Sustained improvement in cash conversion and lower investment intensity, without suppressed maintenance or one-off working-capital releases, would challenge this scenario.
The third scenario is repricing dominated by macroeconomic discount conditions. If long-duration assets across industries adjust together and rates or risk premia move before company news, a single earnings report is an insufficient explanation. Stable yields combined with concentrated moves among companies disclosing similar operating problems would challenge that reading. The scenarios can coexist. This report assigns no unsupported probabilities; subsequent evidence should revise the explanation rather than merely support the initial narrative.
From technology equities to other risk assets
For the broader market, index weights, common industry information and funding constraints are distinct mechanisms. A large constituent affects an index through its weight; peers can reprice shared demand or cost information; leveraged investors may adjust other positions because of margin requirements, risk budgets or redemptions. These require different evidence: weight attribution, cross-sectional comparisons and funding or positioning data. A simultaneous decline does not identify the dominant mechanism.
Continuous digital-asset trading makes time alignment particularly important. US after-hours trading can coincide with a different liquidity regime in digital assets, while a rolling 24-hour return and a US session return use different starting points. A cross-market study should fix a common event window and examine spot and derivatives prices, volume, open interest and financing conditions. Co-movement between bitcoin and technology shares does not establish a particular capital outflow or forced liquidation.
This extension defines a path for further identification, not an established attribution of market moves. Separating questions by their evidence requirements is more useful than combining policy, AI investment and risk appetite into an unfalsifiable account. Continued research should preserve earlier judgments, later observations and reasons for revision, allowing readers to examine how the analysis changes with evidence.
Measurement and follow-up
Financial amounts are in USD millions, and ratios use unabridged inputs. Operating cash flow, cash property and equipment additions and lease repayments remain separate; non-cash leased assets are not counted again as cash expenditure. Alphabet's rolling balance is the sum of the four listed quarters, and Microsoft's year-on-year comparison uses the same calendar quarter. Consolidated revenue is not labelled AI revenue, and company cash flows are not allocated to AI projects without separate disclosure.
Sources were reviewed on 29 October 2026. Policy analysis is confined to the official statement, and the after-hours price observation to the specified news record. This report does not reconstruct both current-quarter question-and-answer sessions or claim to cover all market-moving news that day. Microsoft's July call is used only for previously disclosed accounting context, not as a substitute for current-quarter guidance.
Near-term follow-up should first add regular-session price and rate evidence to assess whether the after-hours response persisted and was shared across the industry. Subsequent financial reviews should track cash conversion, investment intensity, lease commencements and realised operating results. These horizons cannot substitute for one another. A short-term price recovery does not establish an investment payoff, and later cash improvement cannot reveal investors' motives on the event night.
Sources and observation records
Source review: 29 October 2026. Company financial statements are unaudited. Call times are schedules; the Reuters share-price observation is confined to extended trading.
- Alphabet · Third quarter 2026 results, Exhibit 99.1
Regulatory filing · 2026-10-28
- Microsoft · FY 2027 Q1 earnings release and financial statements
Financial statements · 2026-10-28
- Microsoft · Form 10-Q, quarter ended 30 September 2026
Regulatory filing · 2026-10-28
- Microsoft · FY 2026 Q4 earnings call, prepared remarks and transcript
Company disclosure · 2026-07-29
- Federal Reserve · FOMC statement, 28 October 2026
Primary disclosure · 2026-10-28
- Reuters · Alphabet shares fall after revenue miss, cash burn worsens
News report · 2026-10-28
Research use and editorial responsibility
This report is published by Unique Aurora as market research. AI assisted source discovery, numerical checks and drafting. The analysis, interpretations and publication remain under the firm’s editorial direction. It is not investment advice or a recommendation to trade.
For a correction or replication question, identify the report ID, version and the passage or calculation concerned. info@uniqueaurora.org